

Posted by Dr Hannah Bunting
15 April 2026Dr Hannah Bunting presents new analysis of candidates running for local government this year — the results suggest voters will see longer ballot papers with fewer women.
A bumper year for local elections: more candidates, longer ballots, and worsening gender representation
By Dr Hannah Bunting
The 2026 local elections are shaping up to be significant on several dimensions. Across England, voters will head to the polls to elect councillors to 5,013 seats (plus a small number of by-elections), spanning 136 local authorities. That’s roughly 30% of all principal local authority councillors up for election in one day. Nearly 25,000 candidates contest the seats.
This large electoral cycle is partly the result of boundary reviews, which have triggered all-out elections in several councils. Around one in five wards now have new boundaries, meaning that their comparisons to previous elections rely on notional results rather than the last time a seat was up. The geography of the elections is also notable – more than half of all seats are in London and the South East, areas that have historically favoured Labour.
This is reflected in the political context. Labour is defending around half of all seats, while the Conservatives account for roughly another quarter. A handful of the seats up are compared to 2021, most to 2022, and some to 2023 and 2024. Because there were no directly comparable elections in 2025, Reform UK are defending almost no seats. Yet the expectation is that Labour will lose heavily and Reform are set to gain.
More candidates, but not necessarily more competition per seat
One of the most talked about features of recent British politics is increasing fragmentation, with more parties, along with more Independent candidates, both standing and posing credible challenges. The question for 2026 is whether this trend has continued.
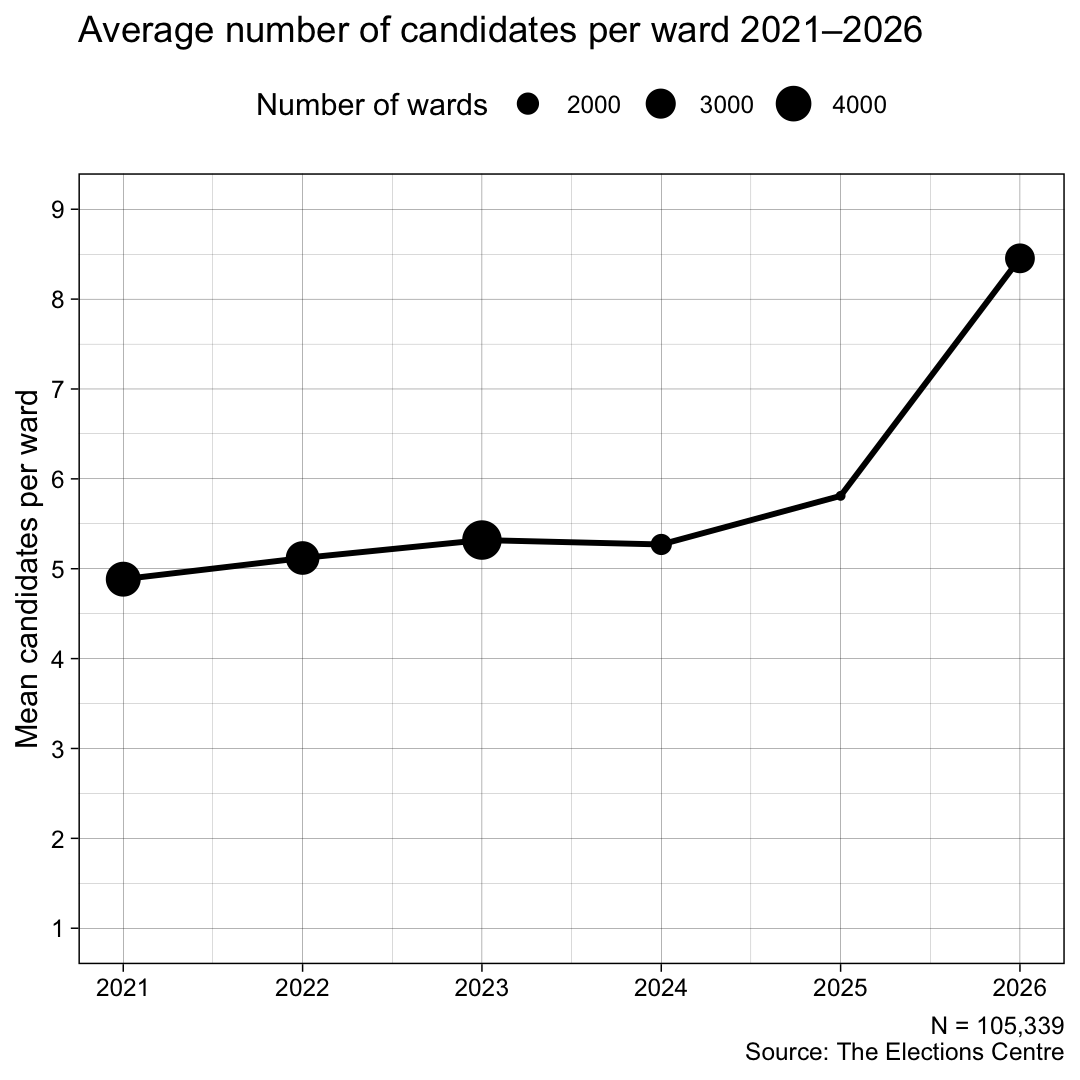

At first glance, the answer appears to be yes. The average number of candidates per ward has risen sharply from around five in 2021 to more than eight in 2026.
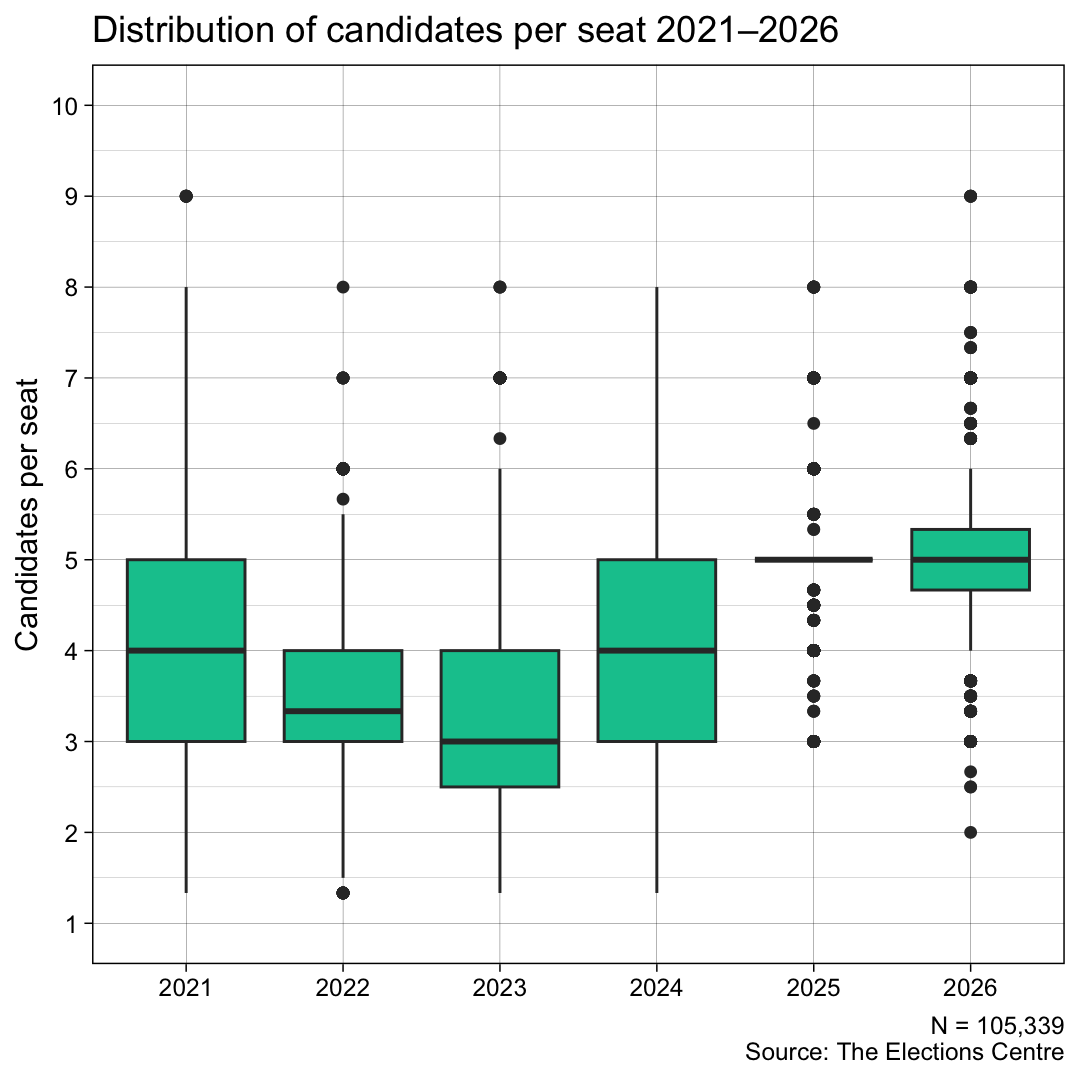
However, it’s important to remember the multi-member nature of this year’s elections to reveal the real story. When we adjust for the number of seats available in each ward and examine candidates per seat, the increase largely disappears. In 2026, there are on average around five candidates per seat, roughly the same as in 2025 (though still higher than earlier years).
This suggests the level of direct competition for each seat has stabilised. In other words, we may be approaching a ceiling in terms of how many candidates realistically contest each individual seat—even in a bumper election year. It’s difficult to muster thousands of candidates, especially if you need three for hundreds of wards.
Longer ballot papers and more complex choices
Even if competition per seat has plateaued, voters will still notice a difference when they arrive at the polling station – longer ballot papers. This is something we identified in our analysis of the 2025 council by-elections, and looks to be continuing in 2026.
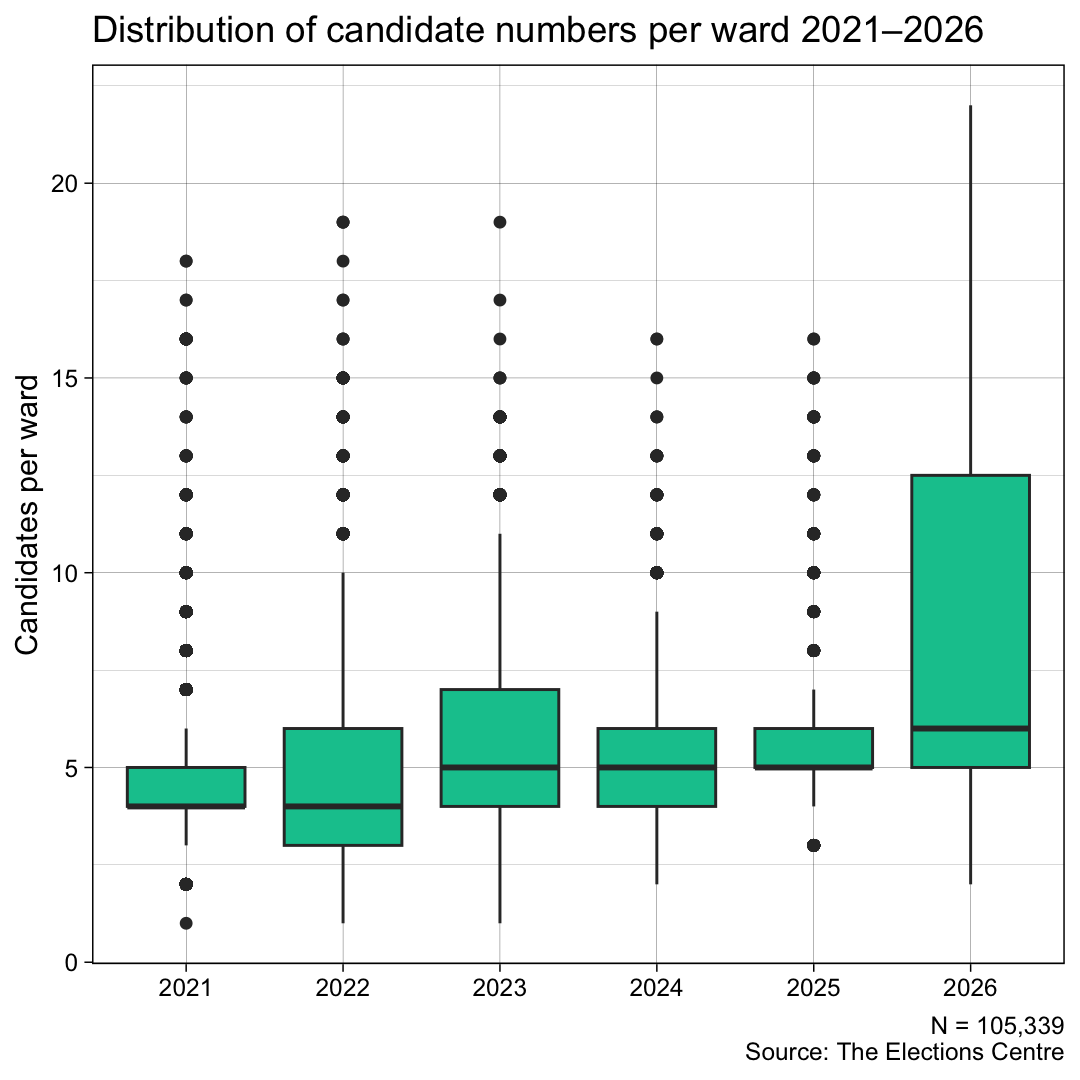
As shown in the distribution of candidates across wards, the typical (median) ward now has six candidates, but many have significantly more. In fact, half of all wards have between five and twelve candidates standing. This is a marked shift from 2021, when most wards had five or fewer candidates.
When we look again at candidates per seat, the picture is more stable – most seats are contested by around five candidates – but this still represents a step change from earlier years, when three-party competition was more common.
The practical implication is that voters are increasingly faced with more complex choices, particularly in multi-member wards where they may have multiple votes to allocate. This raises the necessity of split-ticket voting, where voters choose candidates from different parties, or the likelihood of more voters not using all of their available votes.
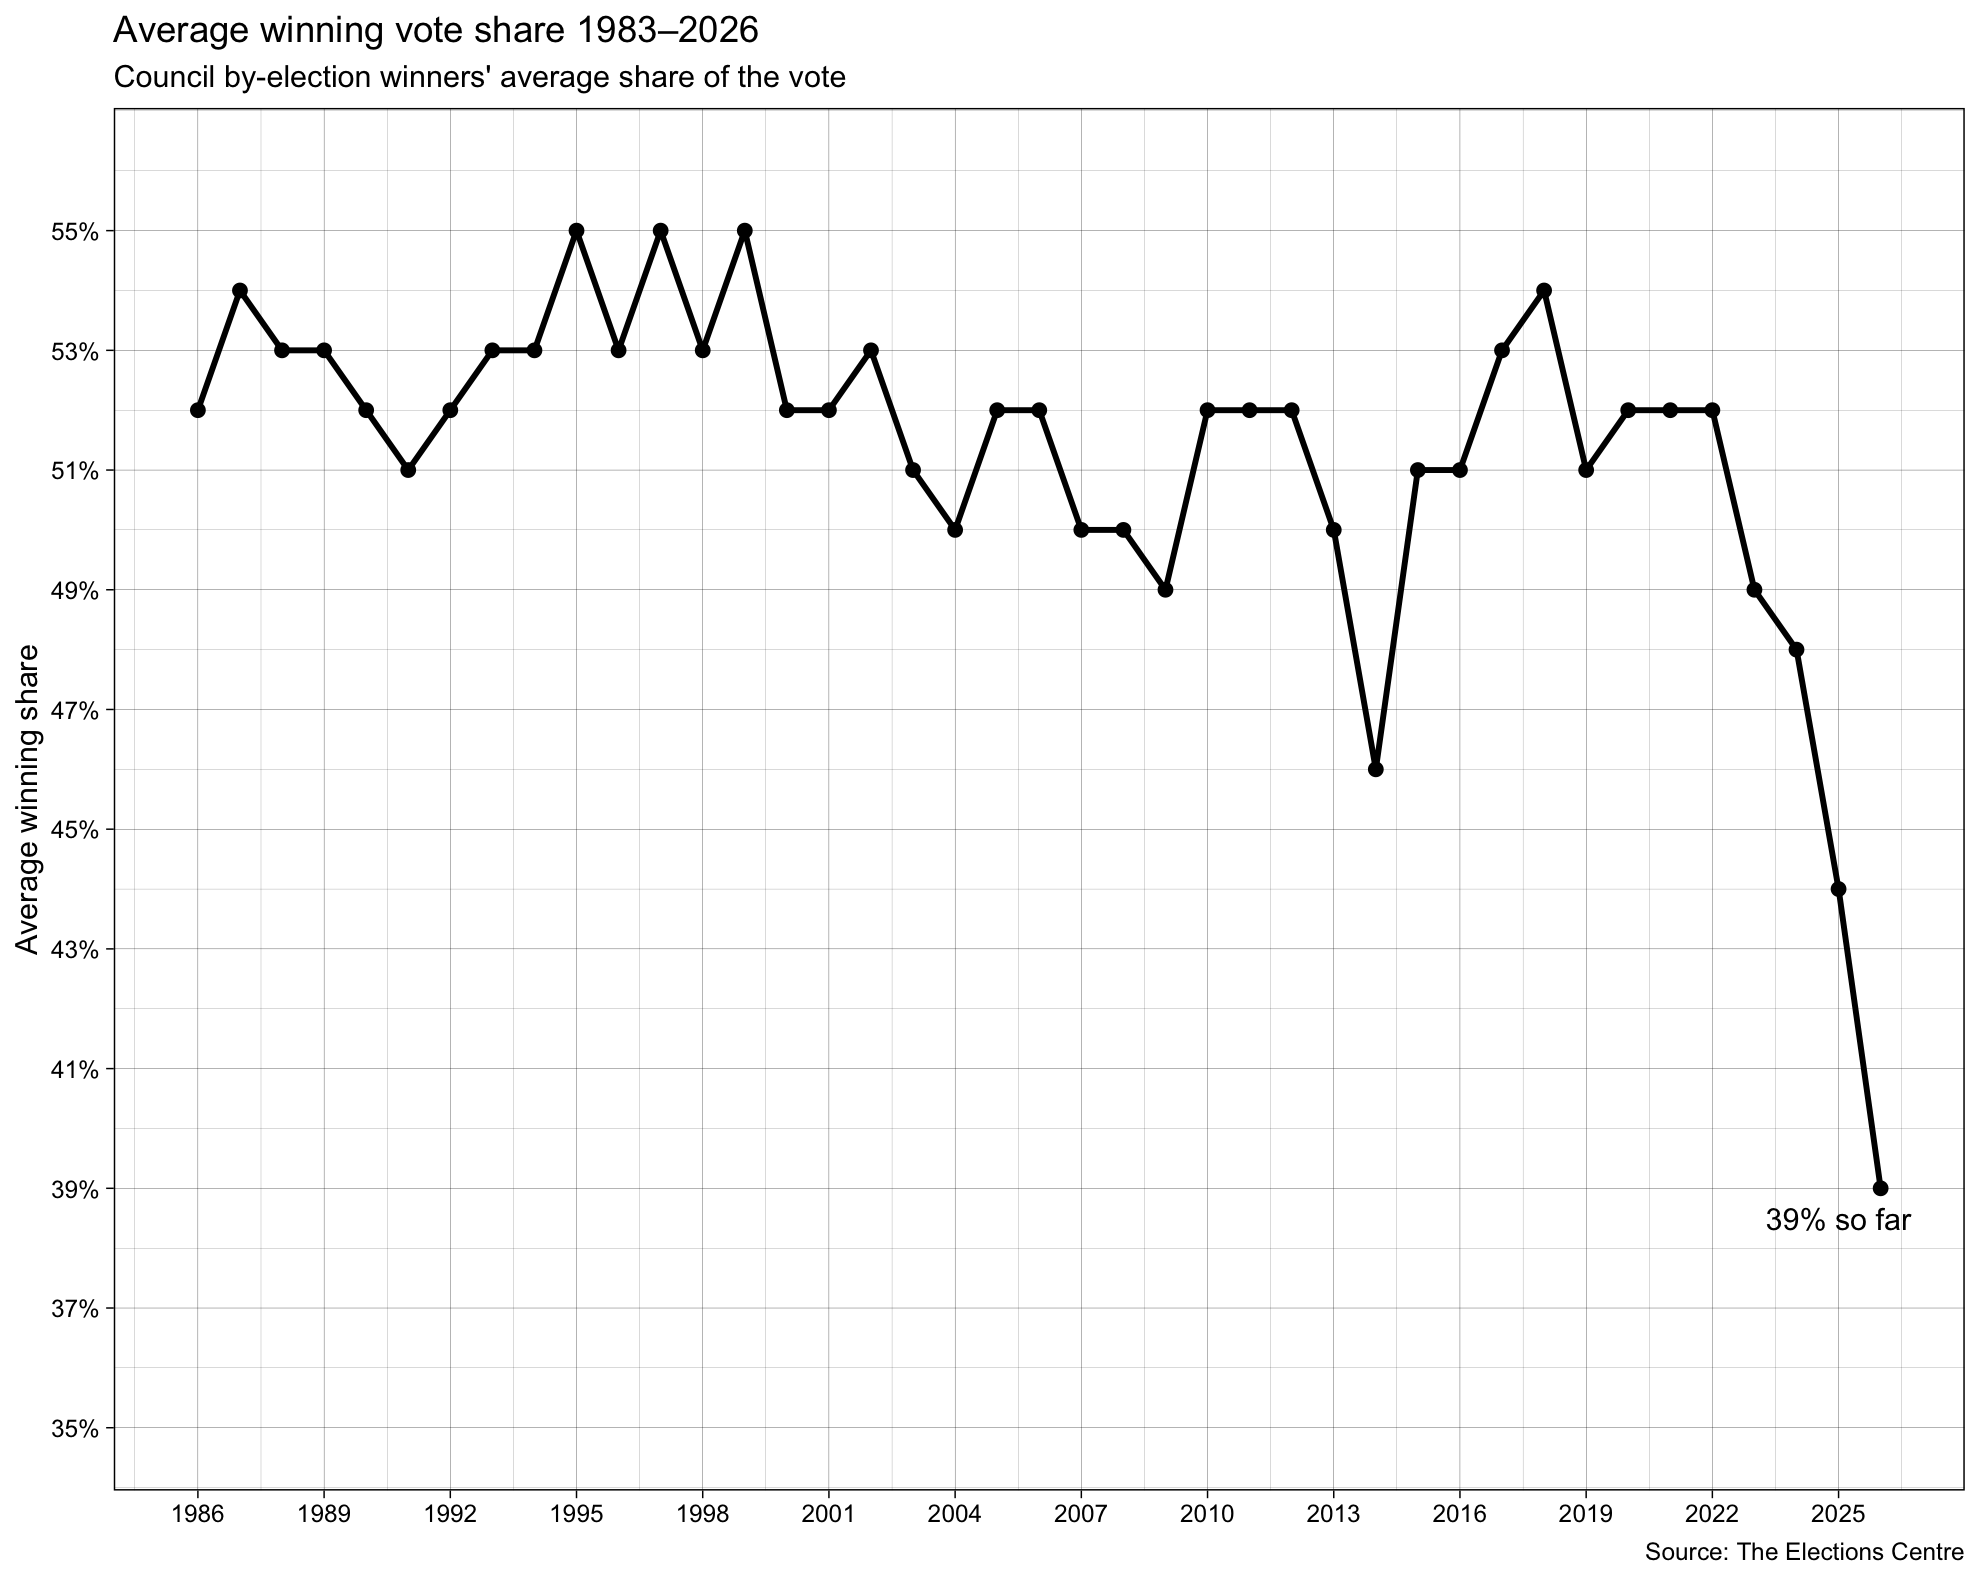
It also means winners will scrape small majorities, and victories on lower vote shares. In the council by-elections held so far in 2026, the winner’s vote share has averaged at just 39%. This has fallen sharply since 2022. Previous to that, the only time it had fallen below 49% was in 2014 when UKIP began contesting more seats.
More parties in the system, but not everywhere
The increase in candidates is closely linked to the number of parties contesting elections. Here, again, the picture depends on how we measure it.
At the ward level, there is evidence of a slight increase in the number of parties standing in 2026. However, when we examine parties per seat, the trend actually reverses: the average falls back to below four parties per seat, similar to levels seen in 2021.
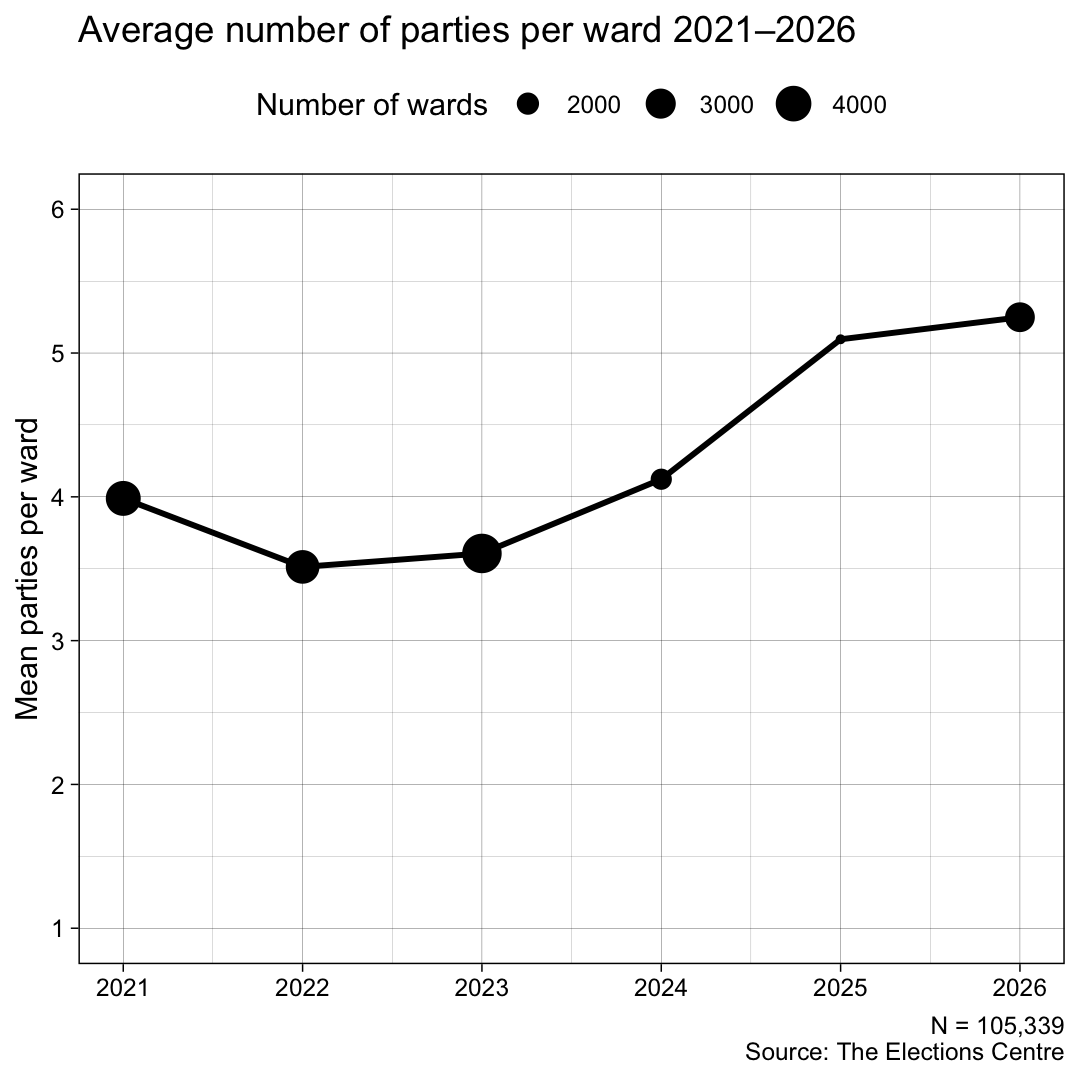
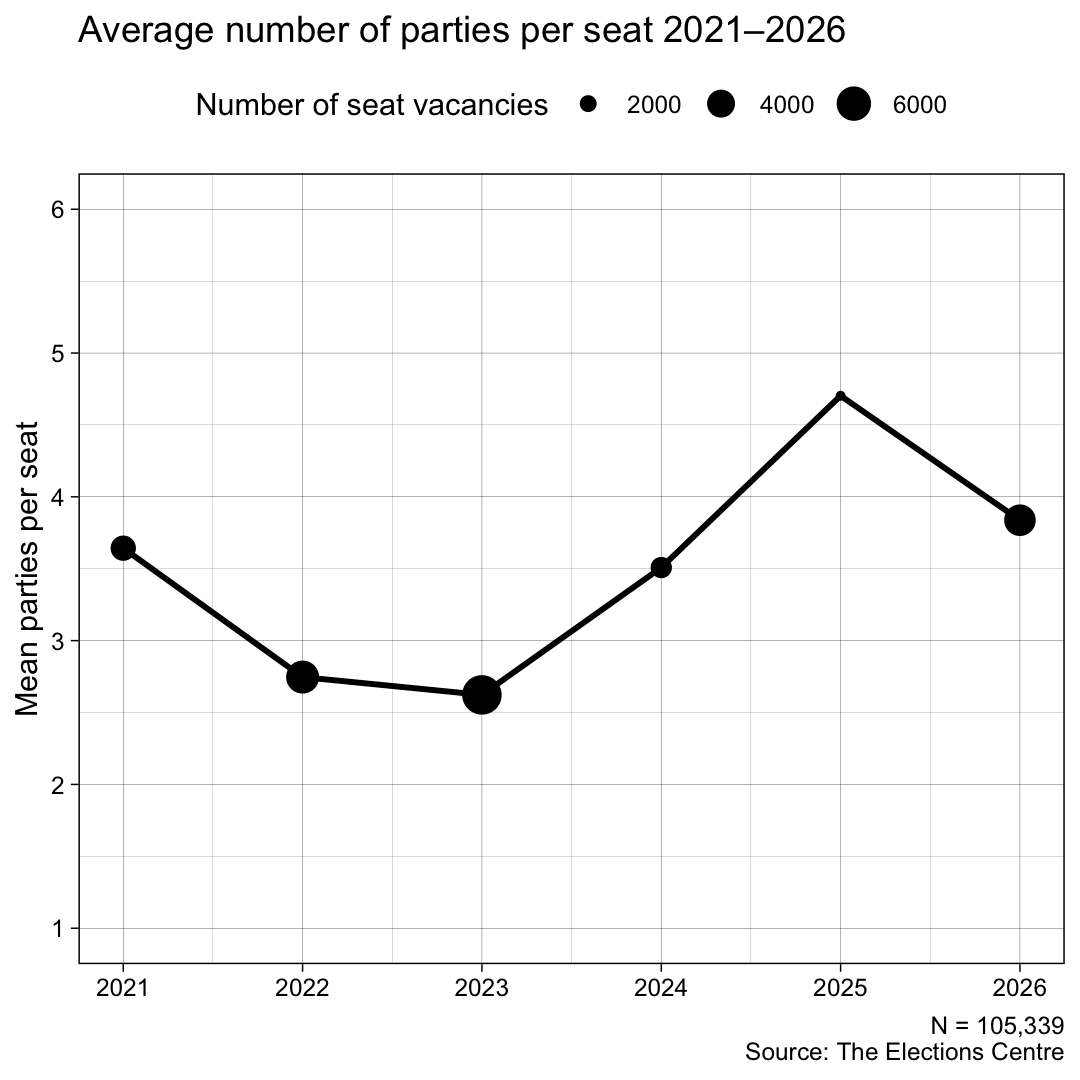
This could be a sign of a strategic shift, or simply not being able to find enough willing volunteers to run for office. Many parties appear to be making sure they are visible in every ward rather than contesting all available vacancies in a ward. That is, in a ward with three seats, a party might stand only one candidate rather than three. This does allow them to concentrate resources but also means the structure of competition varies not just between wards but within them.
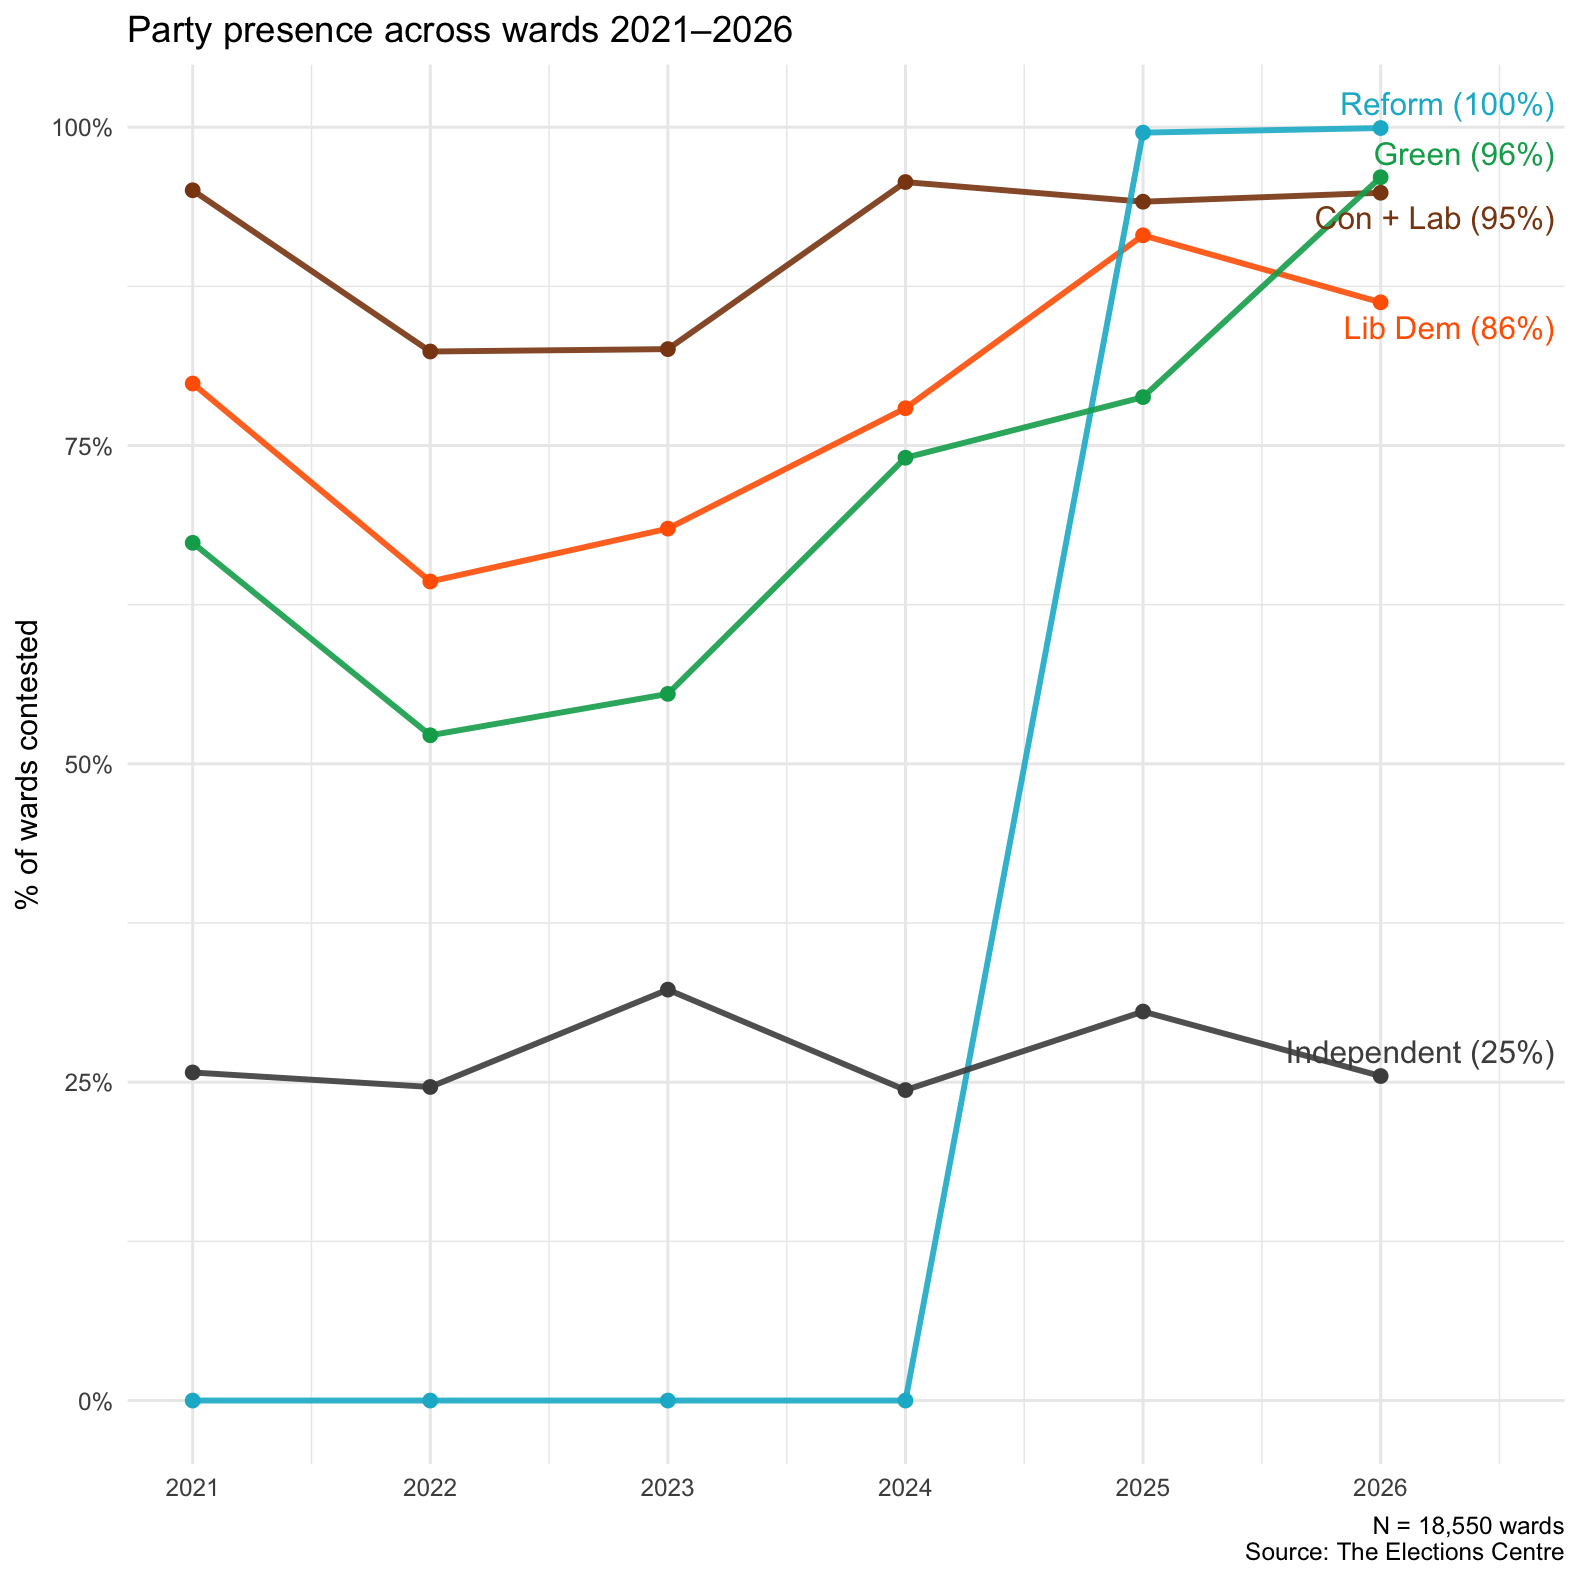
In 2026, Reform are present in the most wards (almost 100%) but don’t contest the most seats – that title goes to Labour (96.5% compared to Reform’s 94.7%). The Conservatives come in third and the Greens are standing in 88.5% of seats. The Liberal Democrats field candidates in 77.8% of seats.
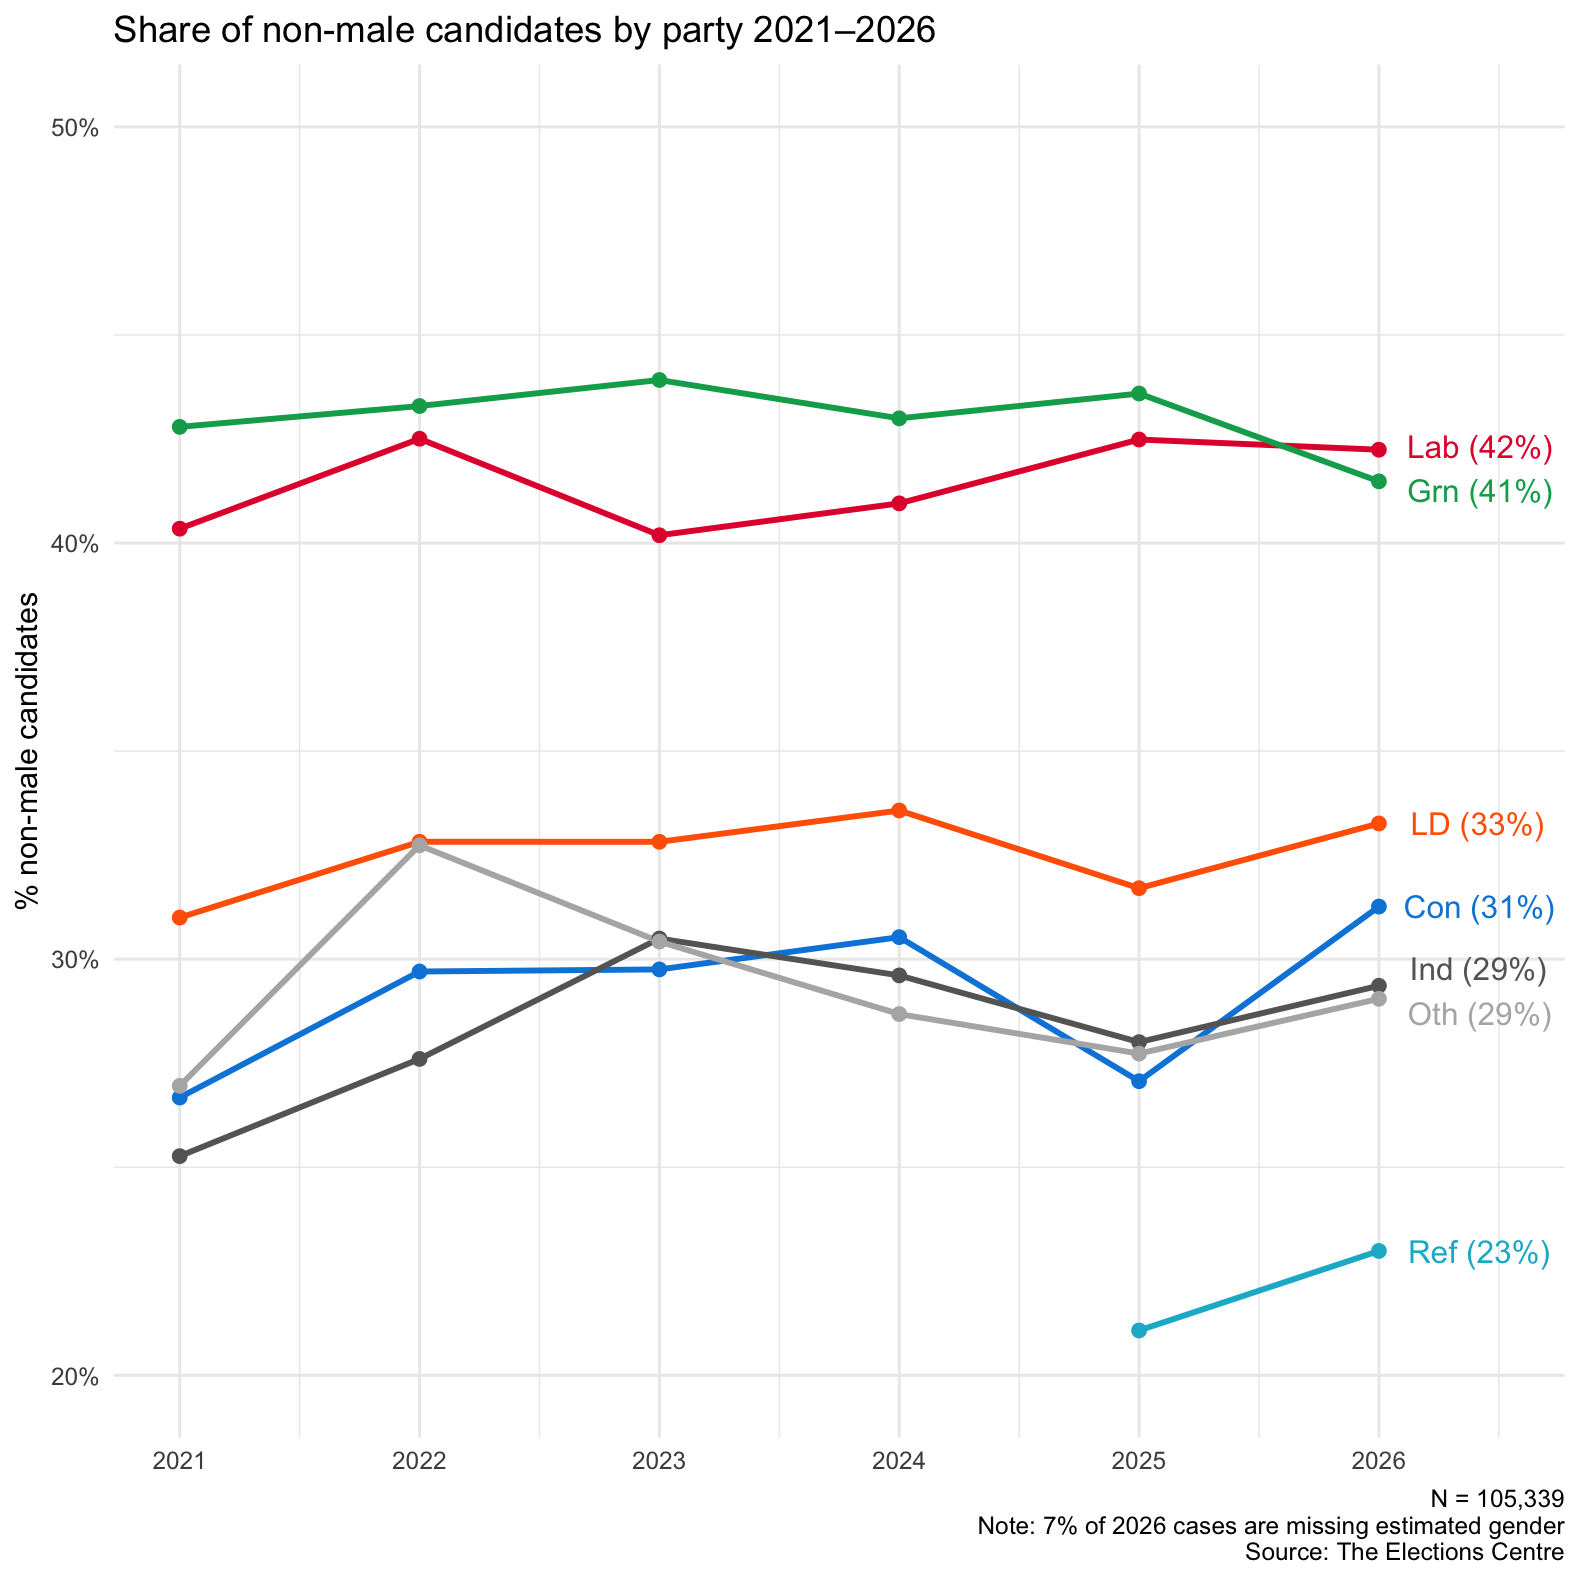
Gender representation may be about to worsen
Beyond the number of candidates and parties, we can assess the gender balance of those standing for election in 2026. Drawing on data from Democracy Club and our own additional analysis, we have been able to estimate the gender of around 93% of candidates.
| Gender | Number of candidates | Proportion of candidates |
| Male | 15,380 | 61.7% |
| Female | 7,826 | 31.4% |
| Non-binary | 22 | < 1% |
| Missing estimated gender | 1,719 | 6.9% |
| Total | 24,947 | 100% |
The headline figure is pretty striking: fewer than one-third of candidates are women or non-binary. In other words, men are standing at almost twice the rate of women. This represents the lowest level of gender balance since 2021, although the final figure may shift slightly once the 7% of candidates with missing data have an estimated gender.
This imbalance is not uniform across parties. Labour and the Green Party consistently field the highest proportions of women and non-binary candidates, at over 40%. The Liberal Democrats sit at around a third, while the Conservatives fall slightly below that level. By contrast, Reform has fewer than a quarter of its candidates who are women.
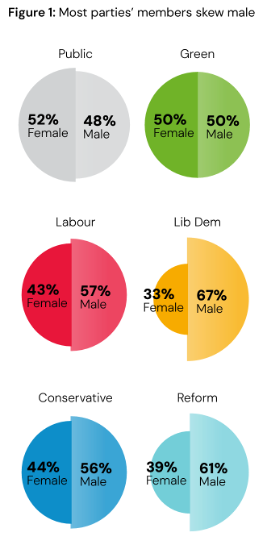
Of course, the total potential candidate pool for each party is based on their membership. Research by Tim Bale and colleagues shows the gender breakdown of each party’s members. In comparing this to the 2026 candidates, Labour and the Liberal Democrats select candidates in roughly the same gender proportions as their membership base. In contrast, the Greens, Conservatives and Reform UK appear to have more women among their members than among their candidates, indicating a gap in candidate selection or recruitment.
What might this mean for representation?
The implications of these patterns extend beyond candidate lists to the composition of councils themselves. Traditionally, election cycles dominated by urban, Labour-leaning areas, as in 2026, tend to produce better gender balance among elected councillors, because the parties strongest in those areas also field more diverse slates of candidates.
Yet the electoral context this year introduces uncertainty around that continuing. If Labour performs as badly as expected, or Reform make significant gains with their much lower proportions of women candidates, the overall gender balance of councillors could shift in the opposite direction.
Taken together, looking ahead to the 2026 local elections shows a transitioning system. There are more candidates and more parties in wards, but not necessarily more competition for each seat. Ballot papers are becoming longer, and voter choice more complex. Winners get smaller majorities.
As the results come in, attention will rightly focus on which parties gain and lose control of councils. But underlying these headline outcomes are deeper structural changes in how local elections are contested, how citizens take part, and what kinds of people become representatives.