
Posted by Dr Hannah Bunting
29 April 2026New analysis shows the possible results in the complex set of upcoming English local elections: Reform are set to top the national equivalent vote share while Labour might be about to break records for majorities lost; the Conservatives could come fifth for seat totals, the Liberal Democrats possibly replacing them as the second largest party of local government, and the Greens may win five times the number of seats they start with.
2026 Local elections projection: three methods of forecasting the outcome show different benchmarks for party performance
By Dr Hannah Bunting
For most residents in the 2,951 wards electing councillors on 7th May, it will be their first opportunity to vote since the general election. That was notoriously difficult to forecast due to multiparty competition, a high proportion of undecided voters, and the challenge in predicting who will turn out on polling day. The 2026 local elections are no different.
The five mainstream parties – Conservative, Labour, Liberal Democrat, Green and Reform UK – all appear together on ballots in 79.5% of wards. Voters are faced with extensive choice and are not, as yet, coordinating around a single party. Slight changes in turnout or party support could produce wildly different outcomes. The additional complexity of thousands of seats across diverse geographic areas, various council types, and assorted baseline comparison years, make predicting the results something of a mug’s game.
Still, there are several ways we can forecast these local elections. Here I present three methods using The Elections Centre data. Unsurprisingly, each analytical approach projects qualitatively different benchmarks – Labour will be hoping to stay in second place, the Conservatives will want to avoid fifth.
Estimating national equivalent vote using council by-elections
It is often forgotten that voting takes place throughout the year, and not only in May or in whichever month the general election is held. There is a council by-election almost every week across England, usually several of them. We can use these real votes in real contests to estimate national equivalent vote share (NEV).
This method takes each council by-election result and compares the vote shares with its last normal-round May election. These changes are added to the latest NEV estimate, or general election result if that was the most recent widespread vote to take place, and are then aggregated to arrive at three-month recency-weighted averages for each party. As these are a function of which casual vacancies have arisen and where recent by-elections have taken place, the overall trend is more important than the specific figures at each time point.
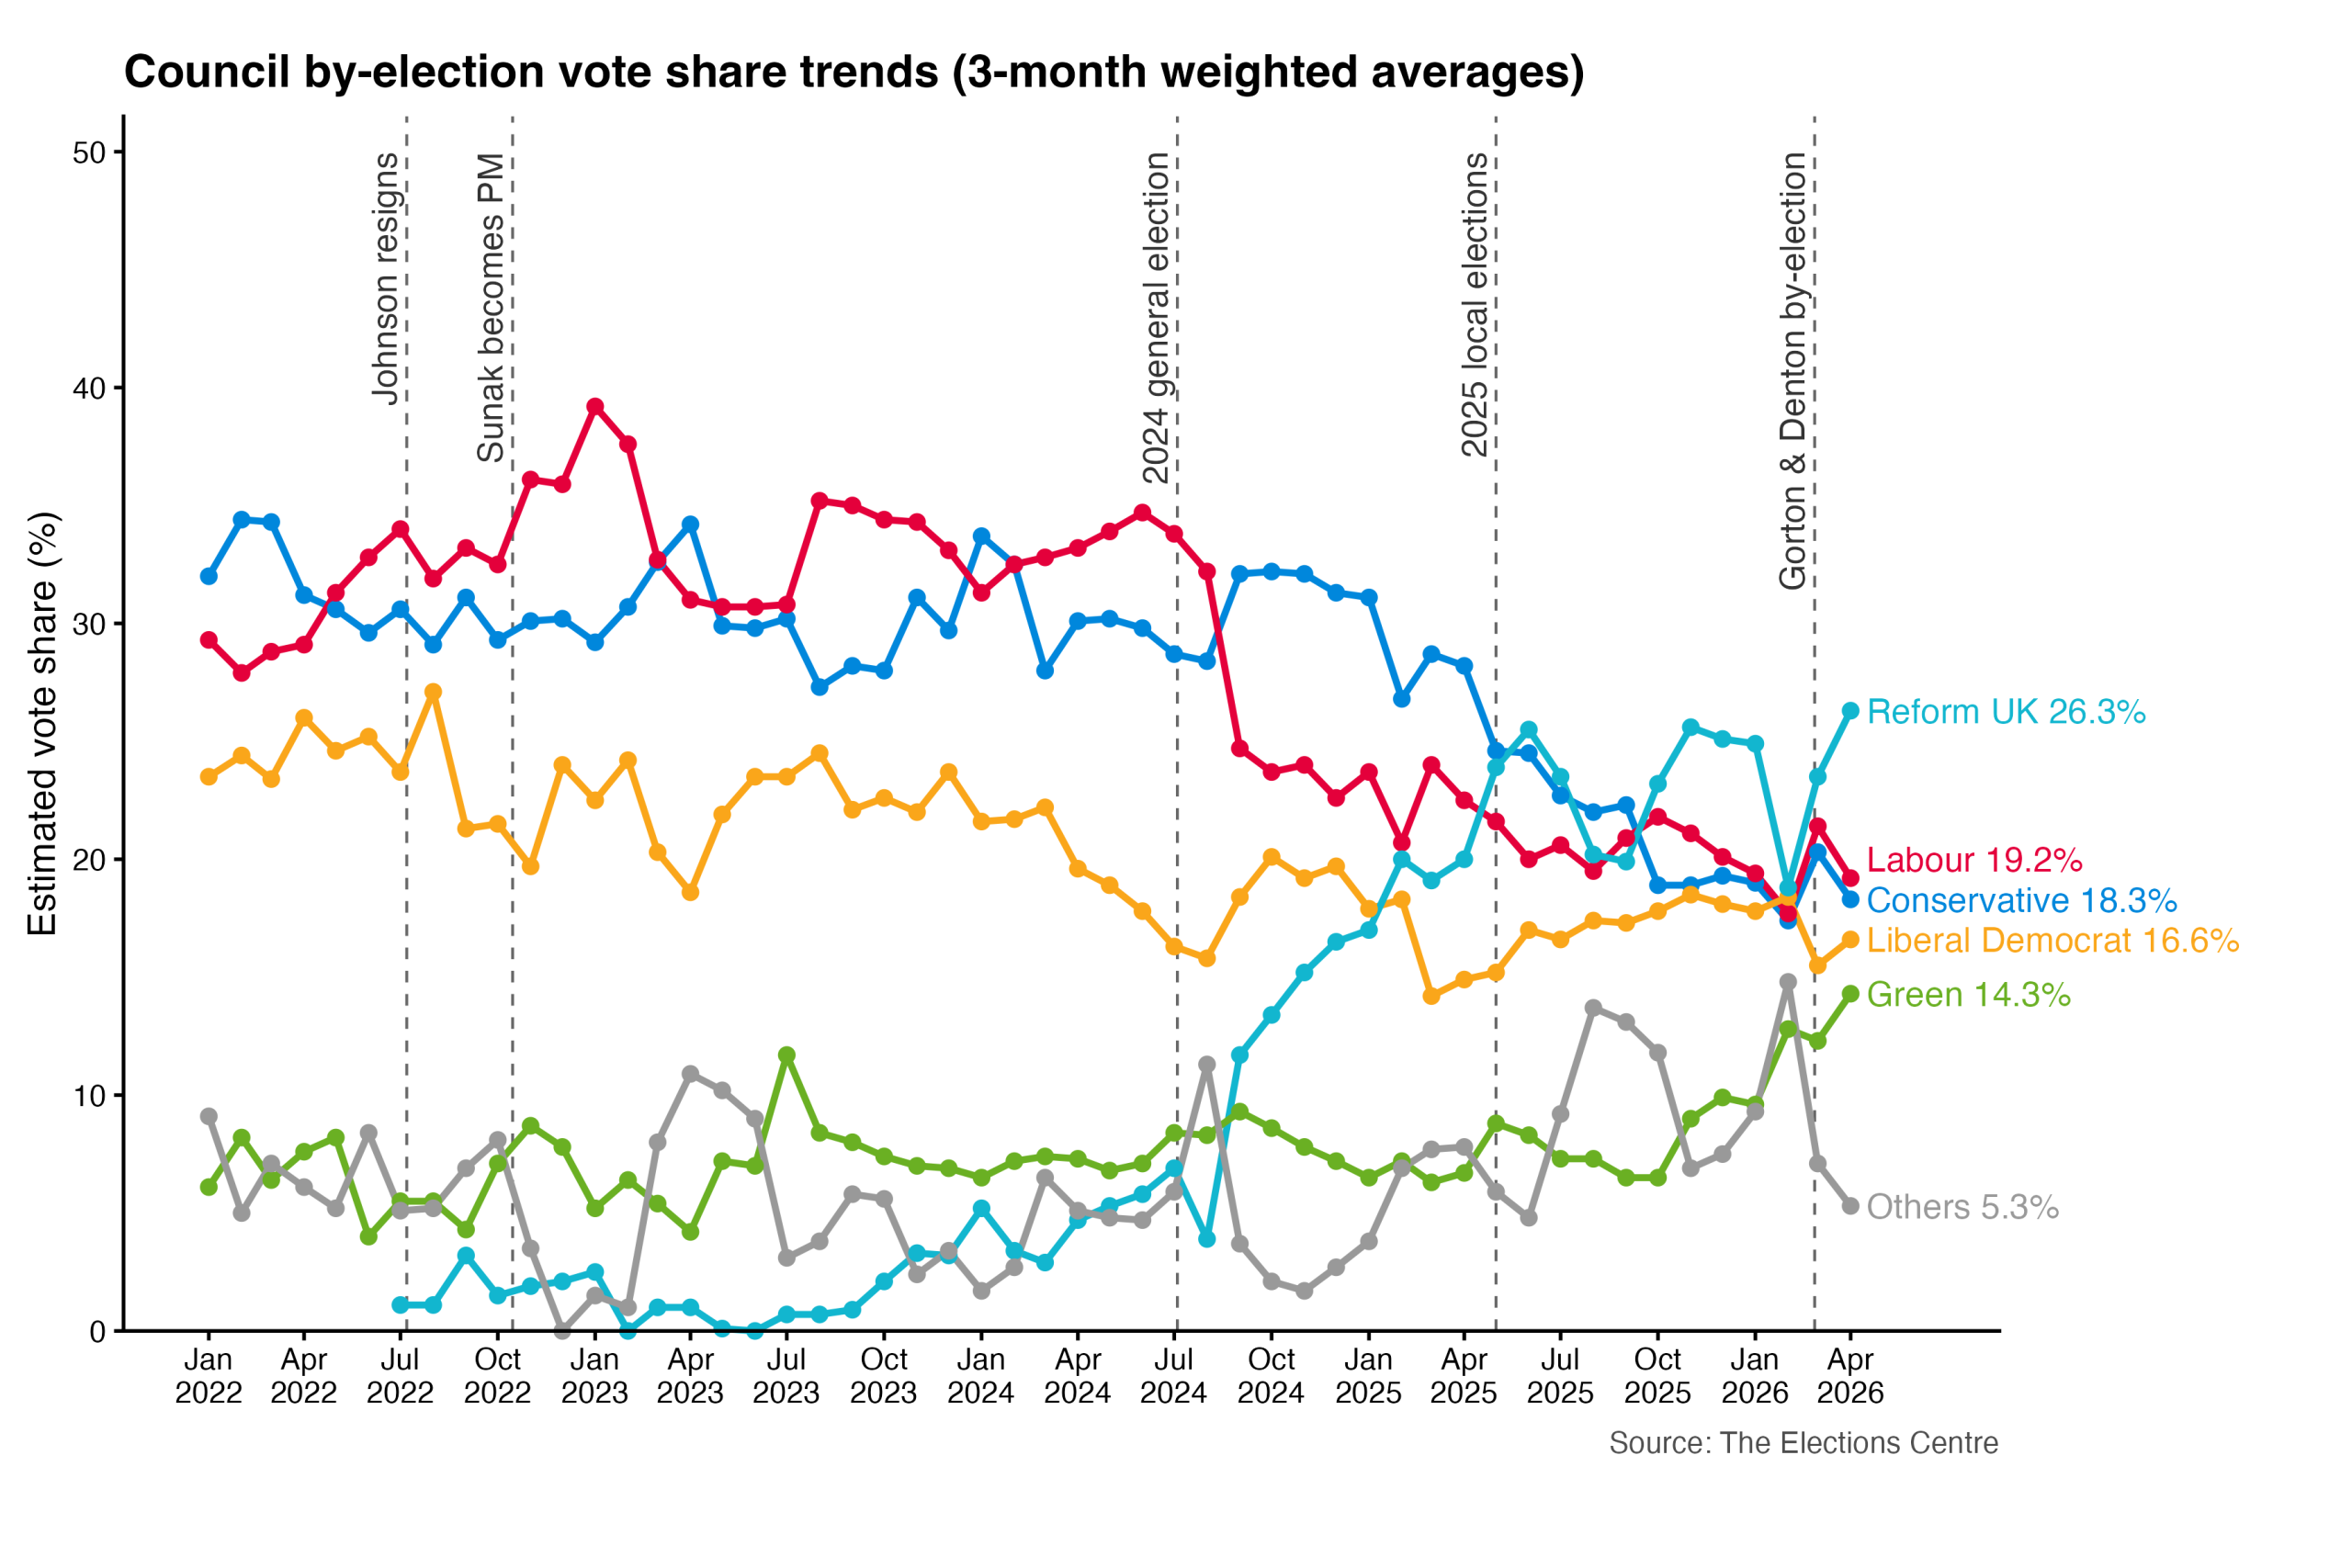
The latest estimates, for April 2026, show Reform UK coming out on top in terms of vote share. They sit at just over a quarter of votes, nearly seven points clear of Labour who remain in second place. The Greens have been on a steady ascension over the past six months to reach 14.3%, whereas Reform are only slightly higher than their typical performance in the same period. The Conservatives enjoyed a modest increase in February but have otherwise been on a consistent decline since shortly after the general election; they arrive at 18.3%, just one point below Labour, and 1.7 points above the Liberal Democrats.
There are less than five percentage points between Labour in second and the Greens in fifth. The competition is fierce. It’s unlikely anyone will catch up with Reform, but beyond that it’s all to play for.
The blunt tool of majorities lost for total seat losses
A common and established method of forecasting is to apply uniform national swing away from one party and towards another. The problem is this was designed for two-party politics with relatively stable patterns of support. Now that there are five parties and volatility, it’s difficult to assess who should be the beneficiary from the swing; it’s no longer possible to accurately assume it would be the party who came in second place last time.
What we can do is look at the majorities the Conservative and Labour parties defend and calculate their potential losses based on swings against them. Each seat has its own baseline year to which we can compare, plus the one in five notionals where boundary changes have occurred that are estimated proportionally.
Labour losses
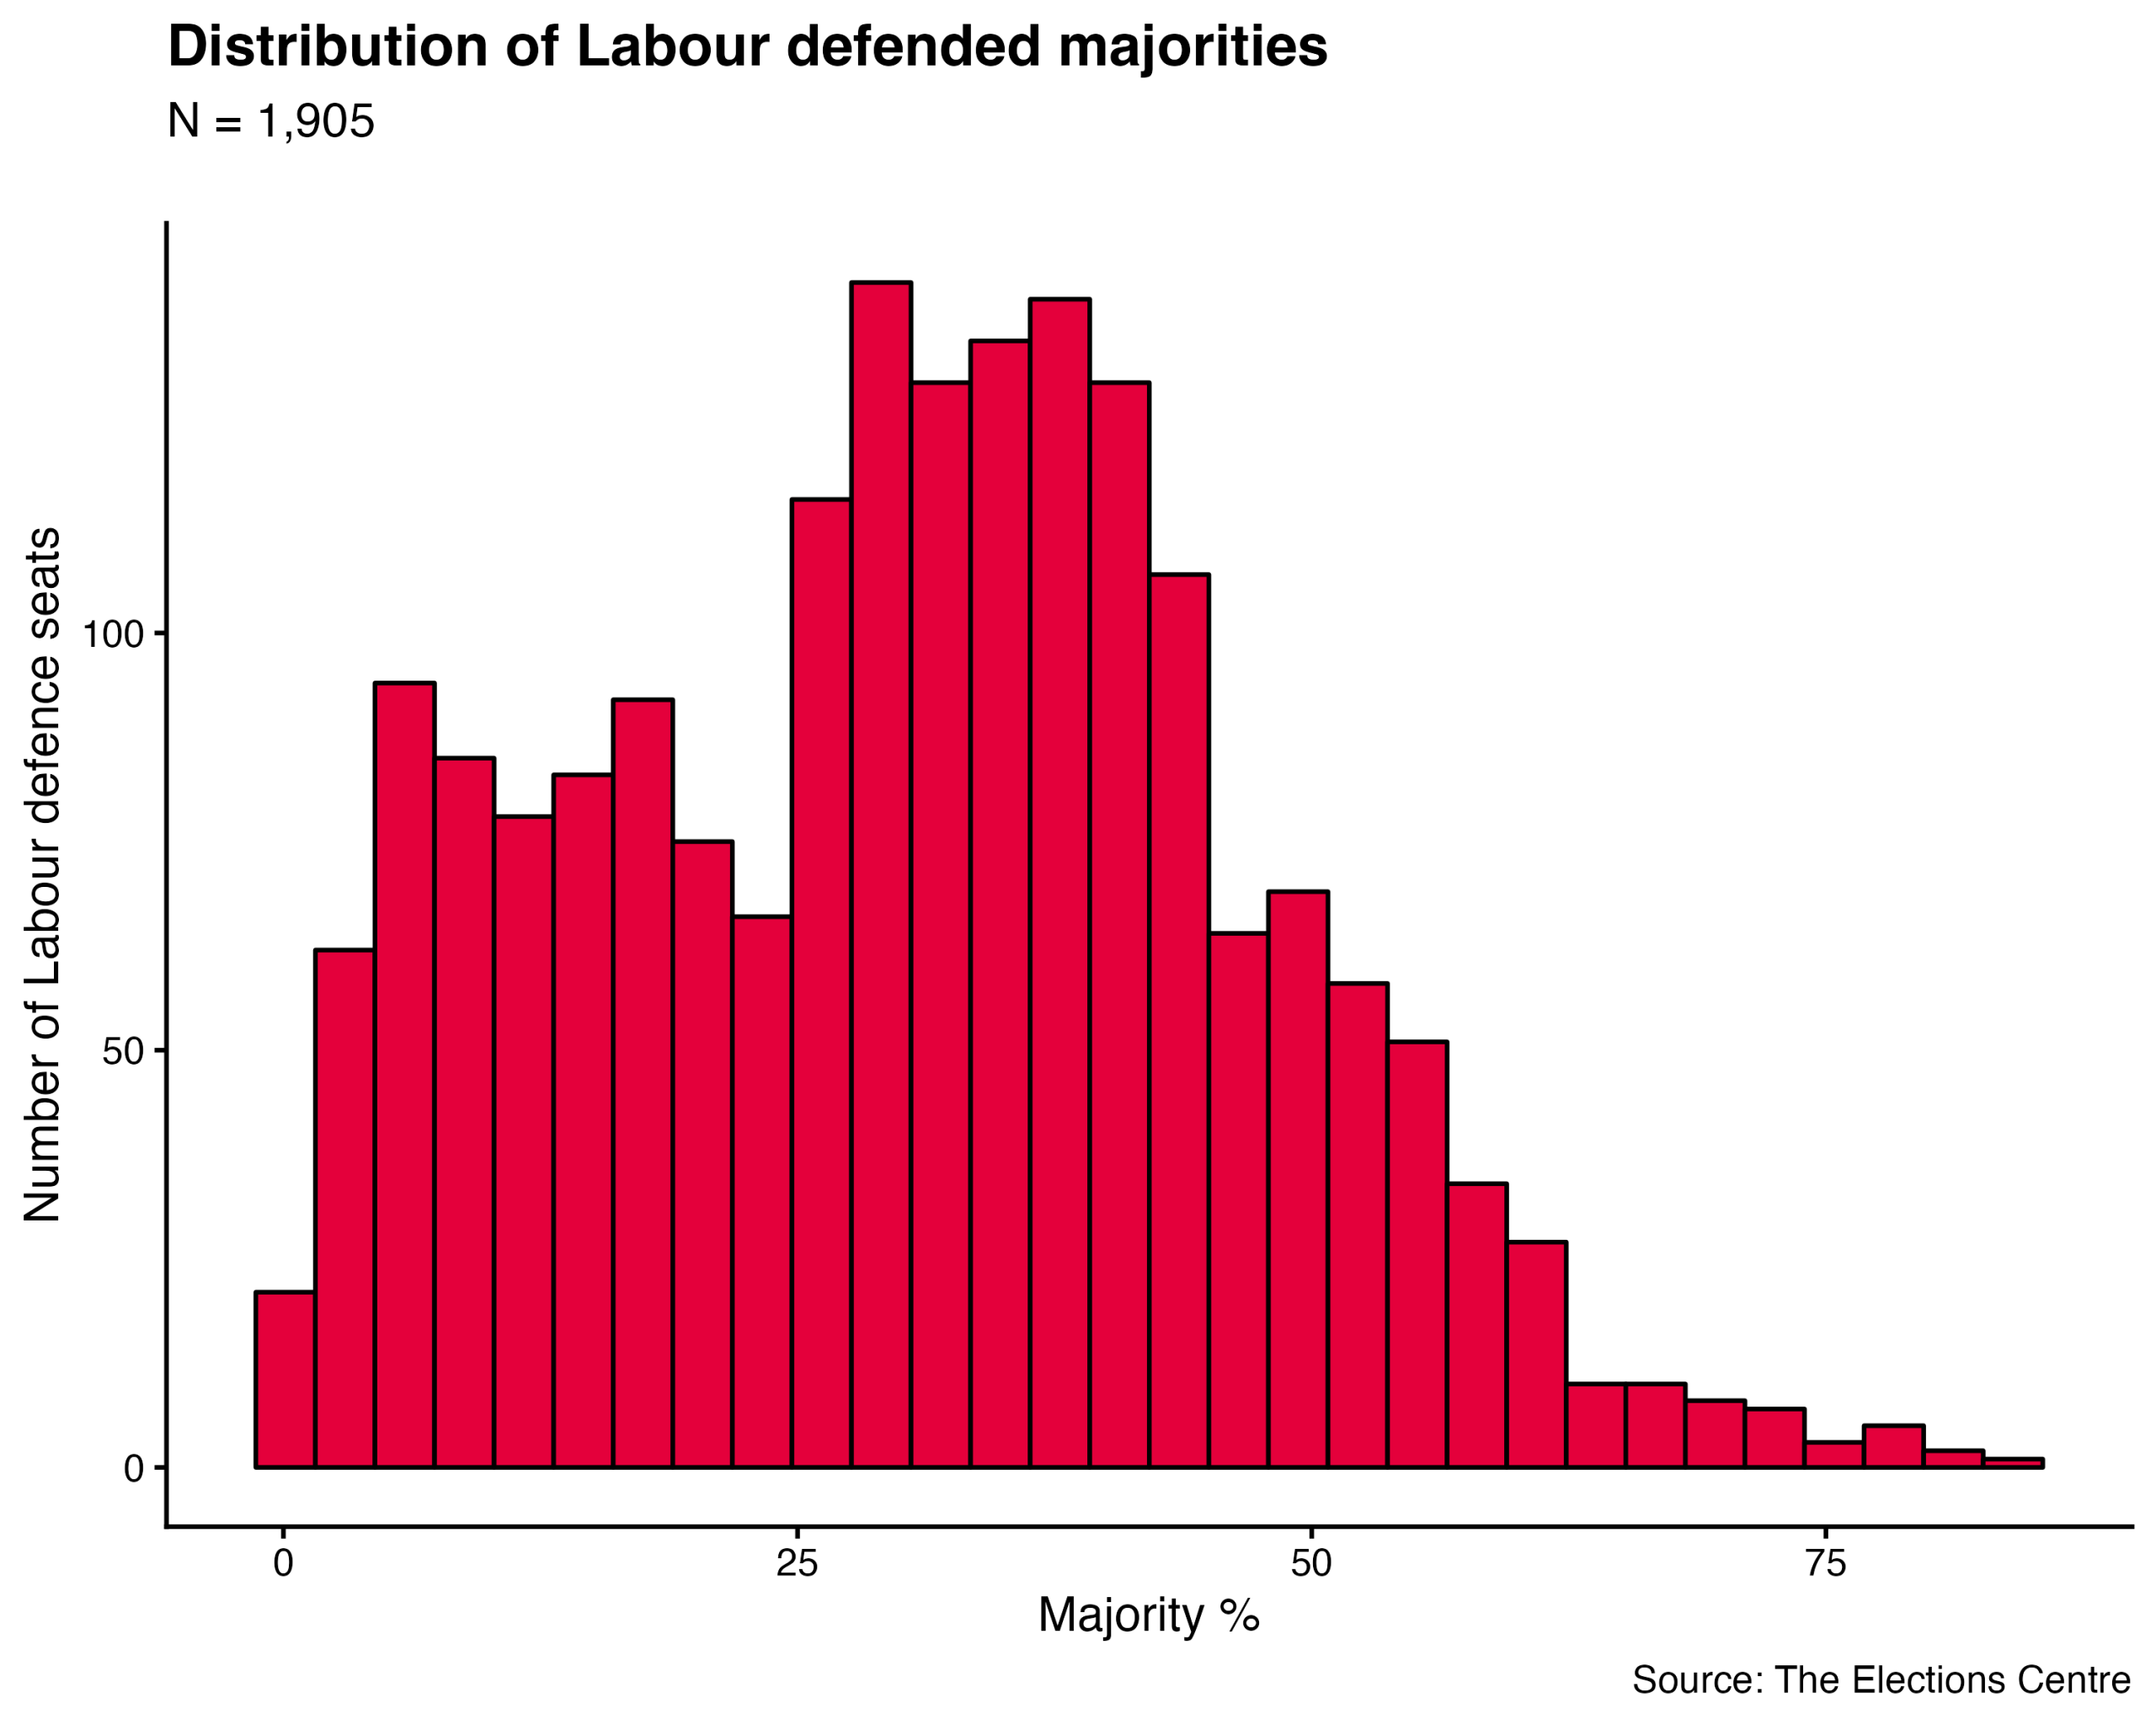
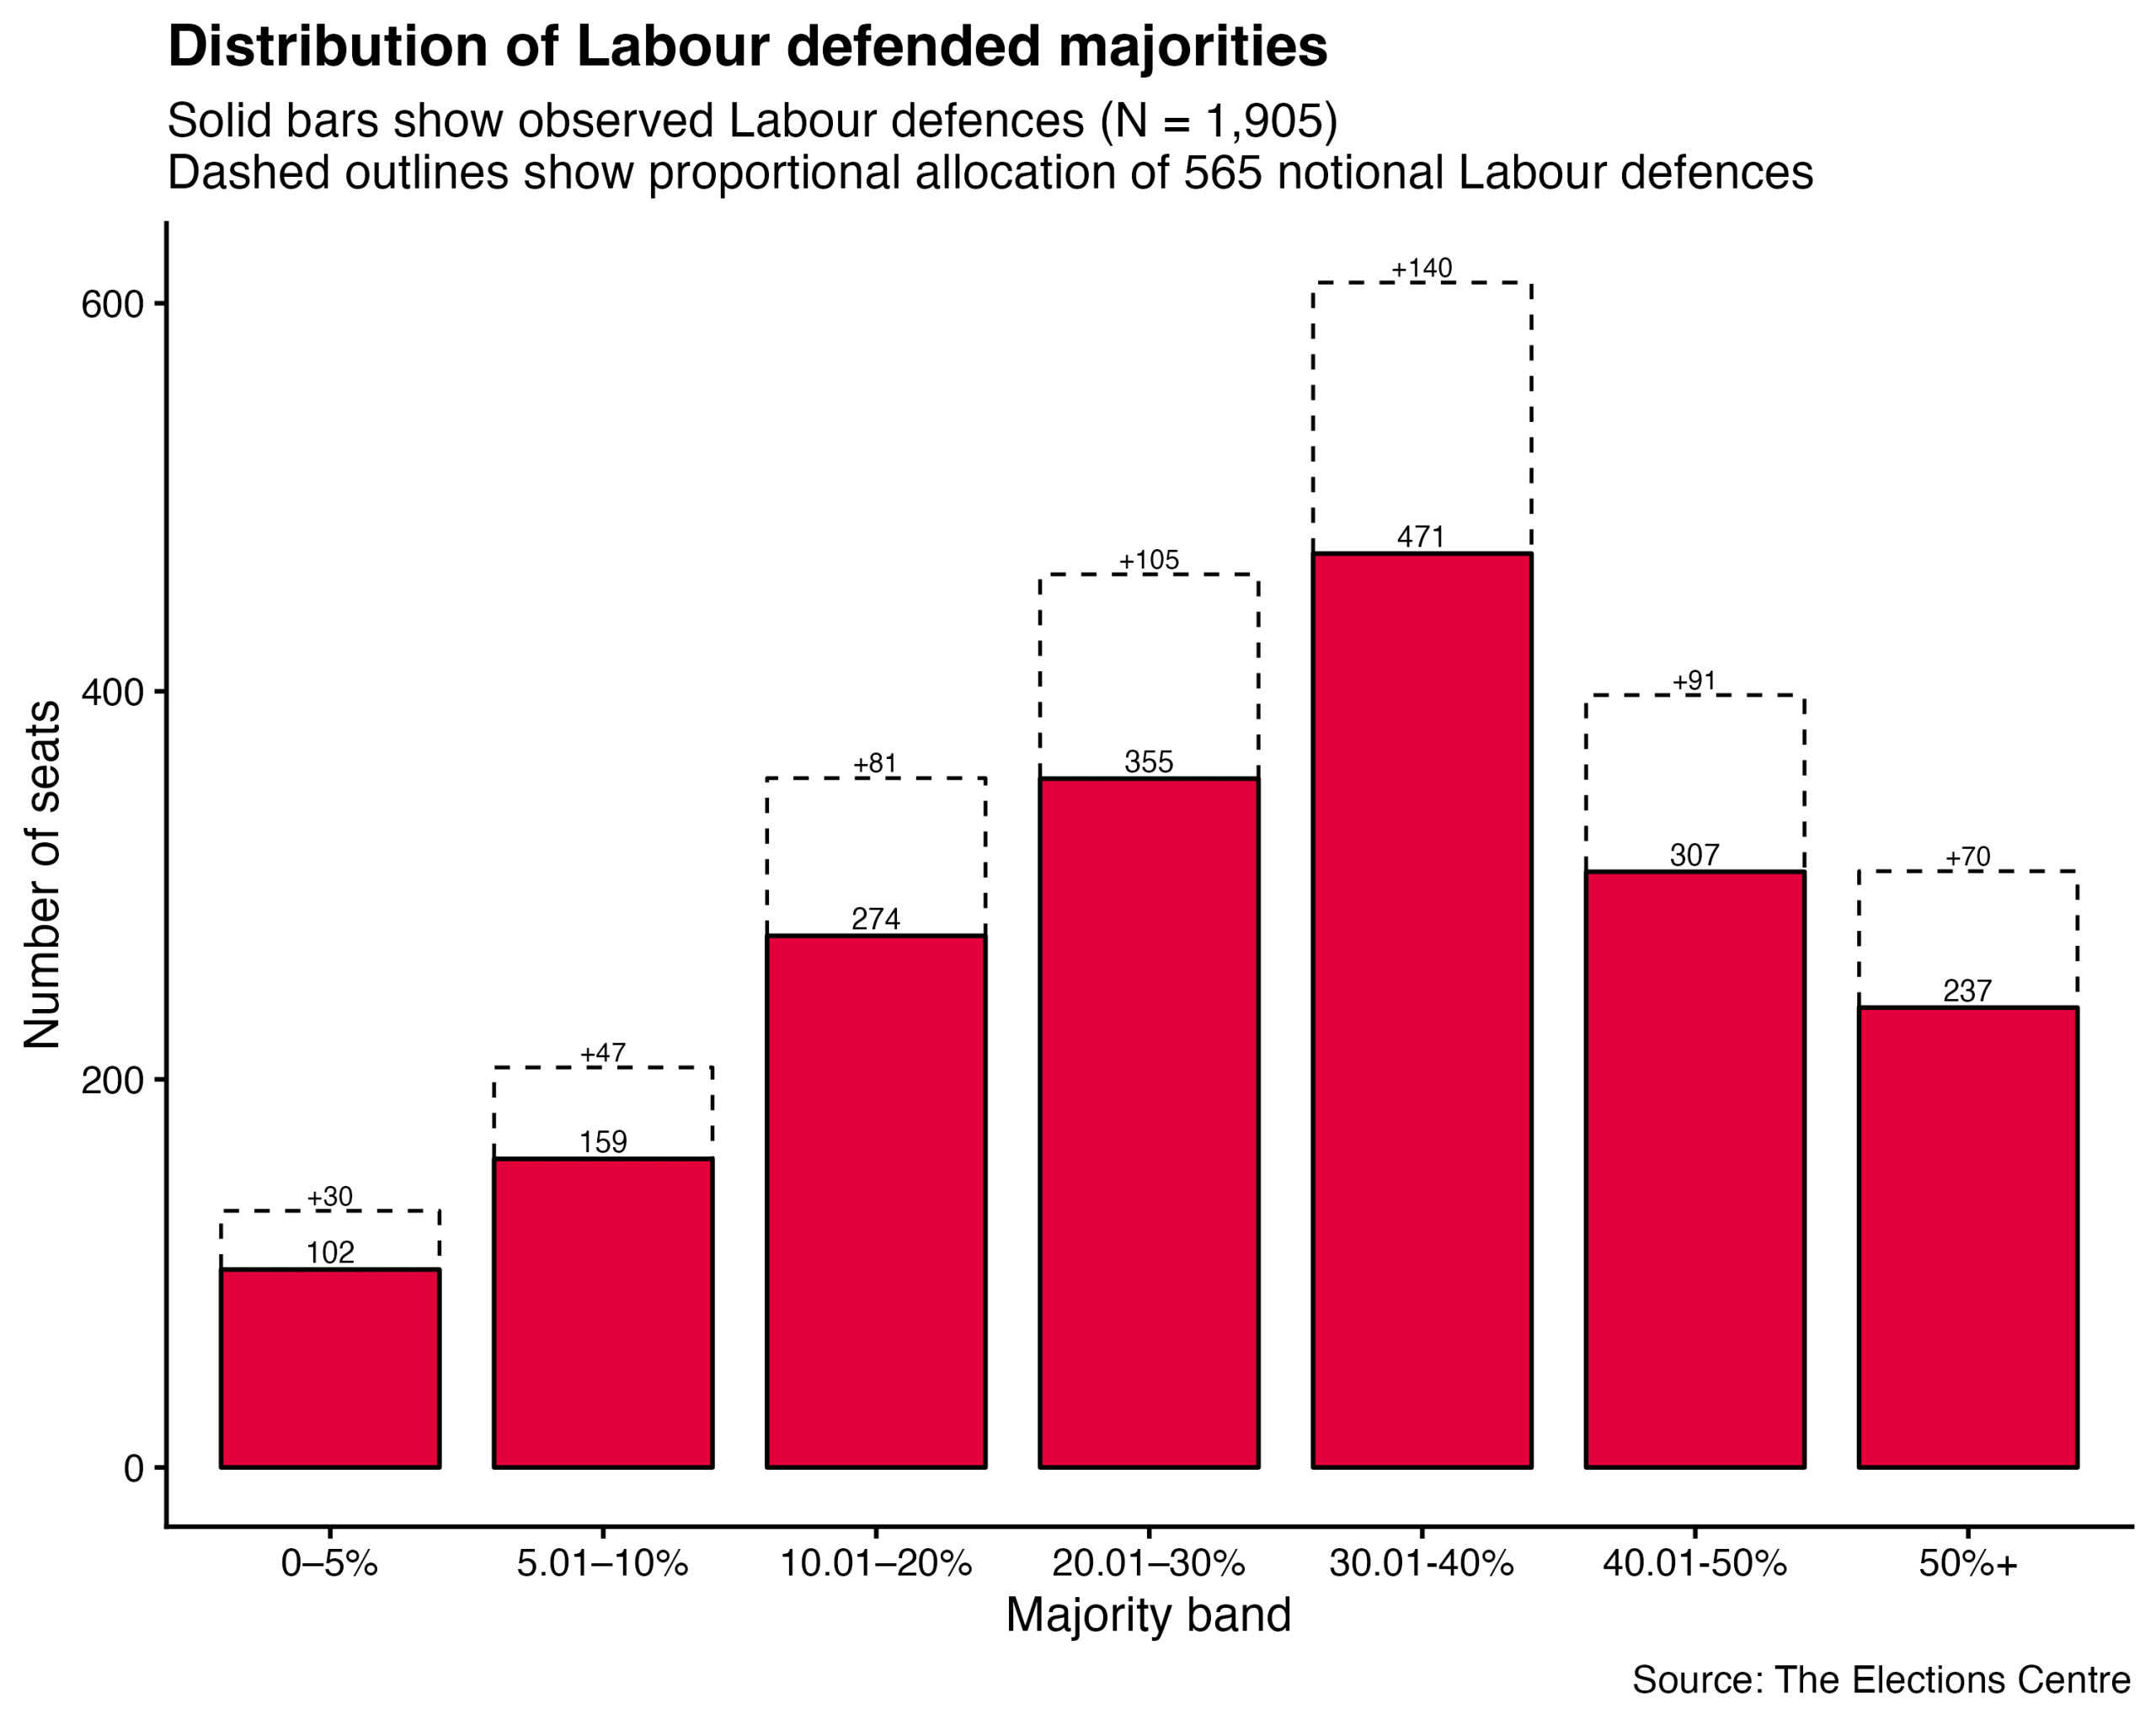
Labour are defending more than half of the seats up in 2026. This election cycle sees a greater number of urban areas with elections, meaning Labour have traditionally done very well. Most of their seats should be considered safe with a majority of more than 25%. Yet in low turnout multiparty elections, almost all seats are vulnerable.
Their best-case scenario is being down 15 percentage points, which would result in around 500 seat losses where they have a majority of 15% or less. The more realistic scenario is a 20-point swing away from Labour, which when applied uniformly means they lose every seat with less than a 40% majority. That would create an outcome of 1,750 losses, holding onto only a third of the seats they defend, in line with the rate of council by-election losses since they entered government. Labour would have to perform catastrophically badly to lose more than 2,000 seats – we’re talking majorities of 50% being overturned – which is not impossible when twelve of their 100 safest majorities had a turnout of less than 20% the last time these seats were up.
Conservative losses
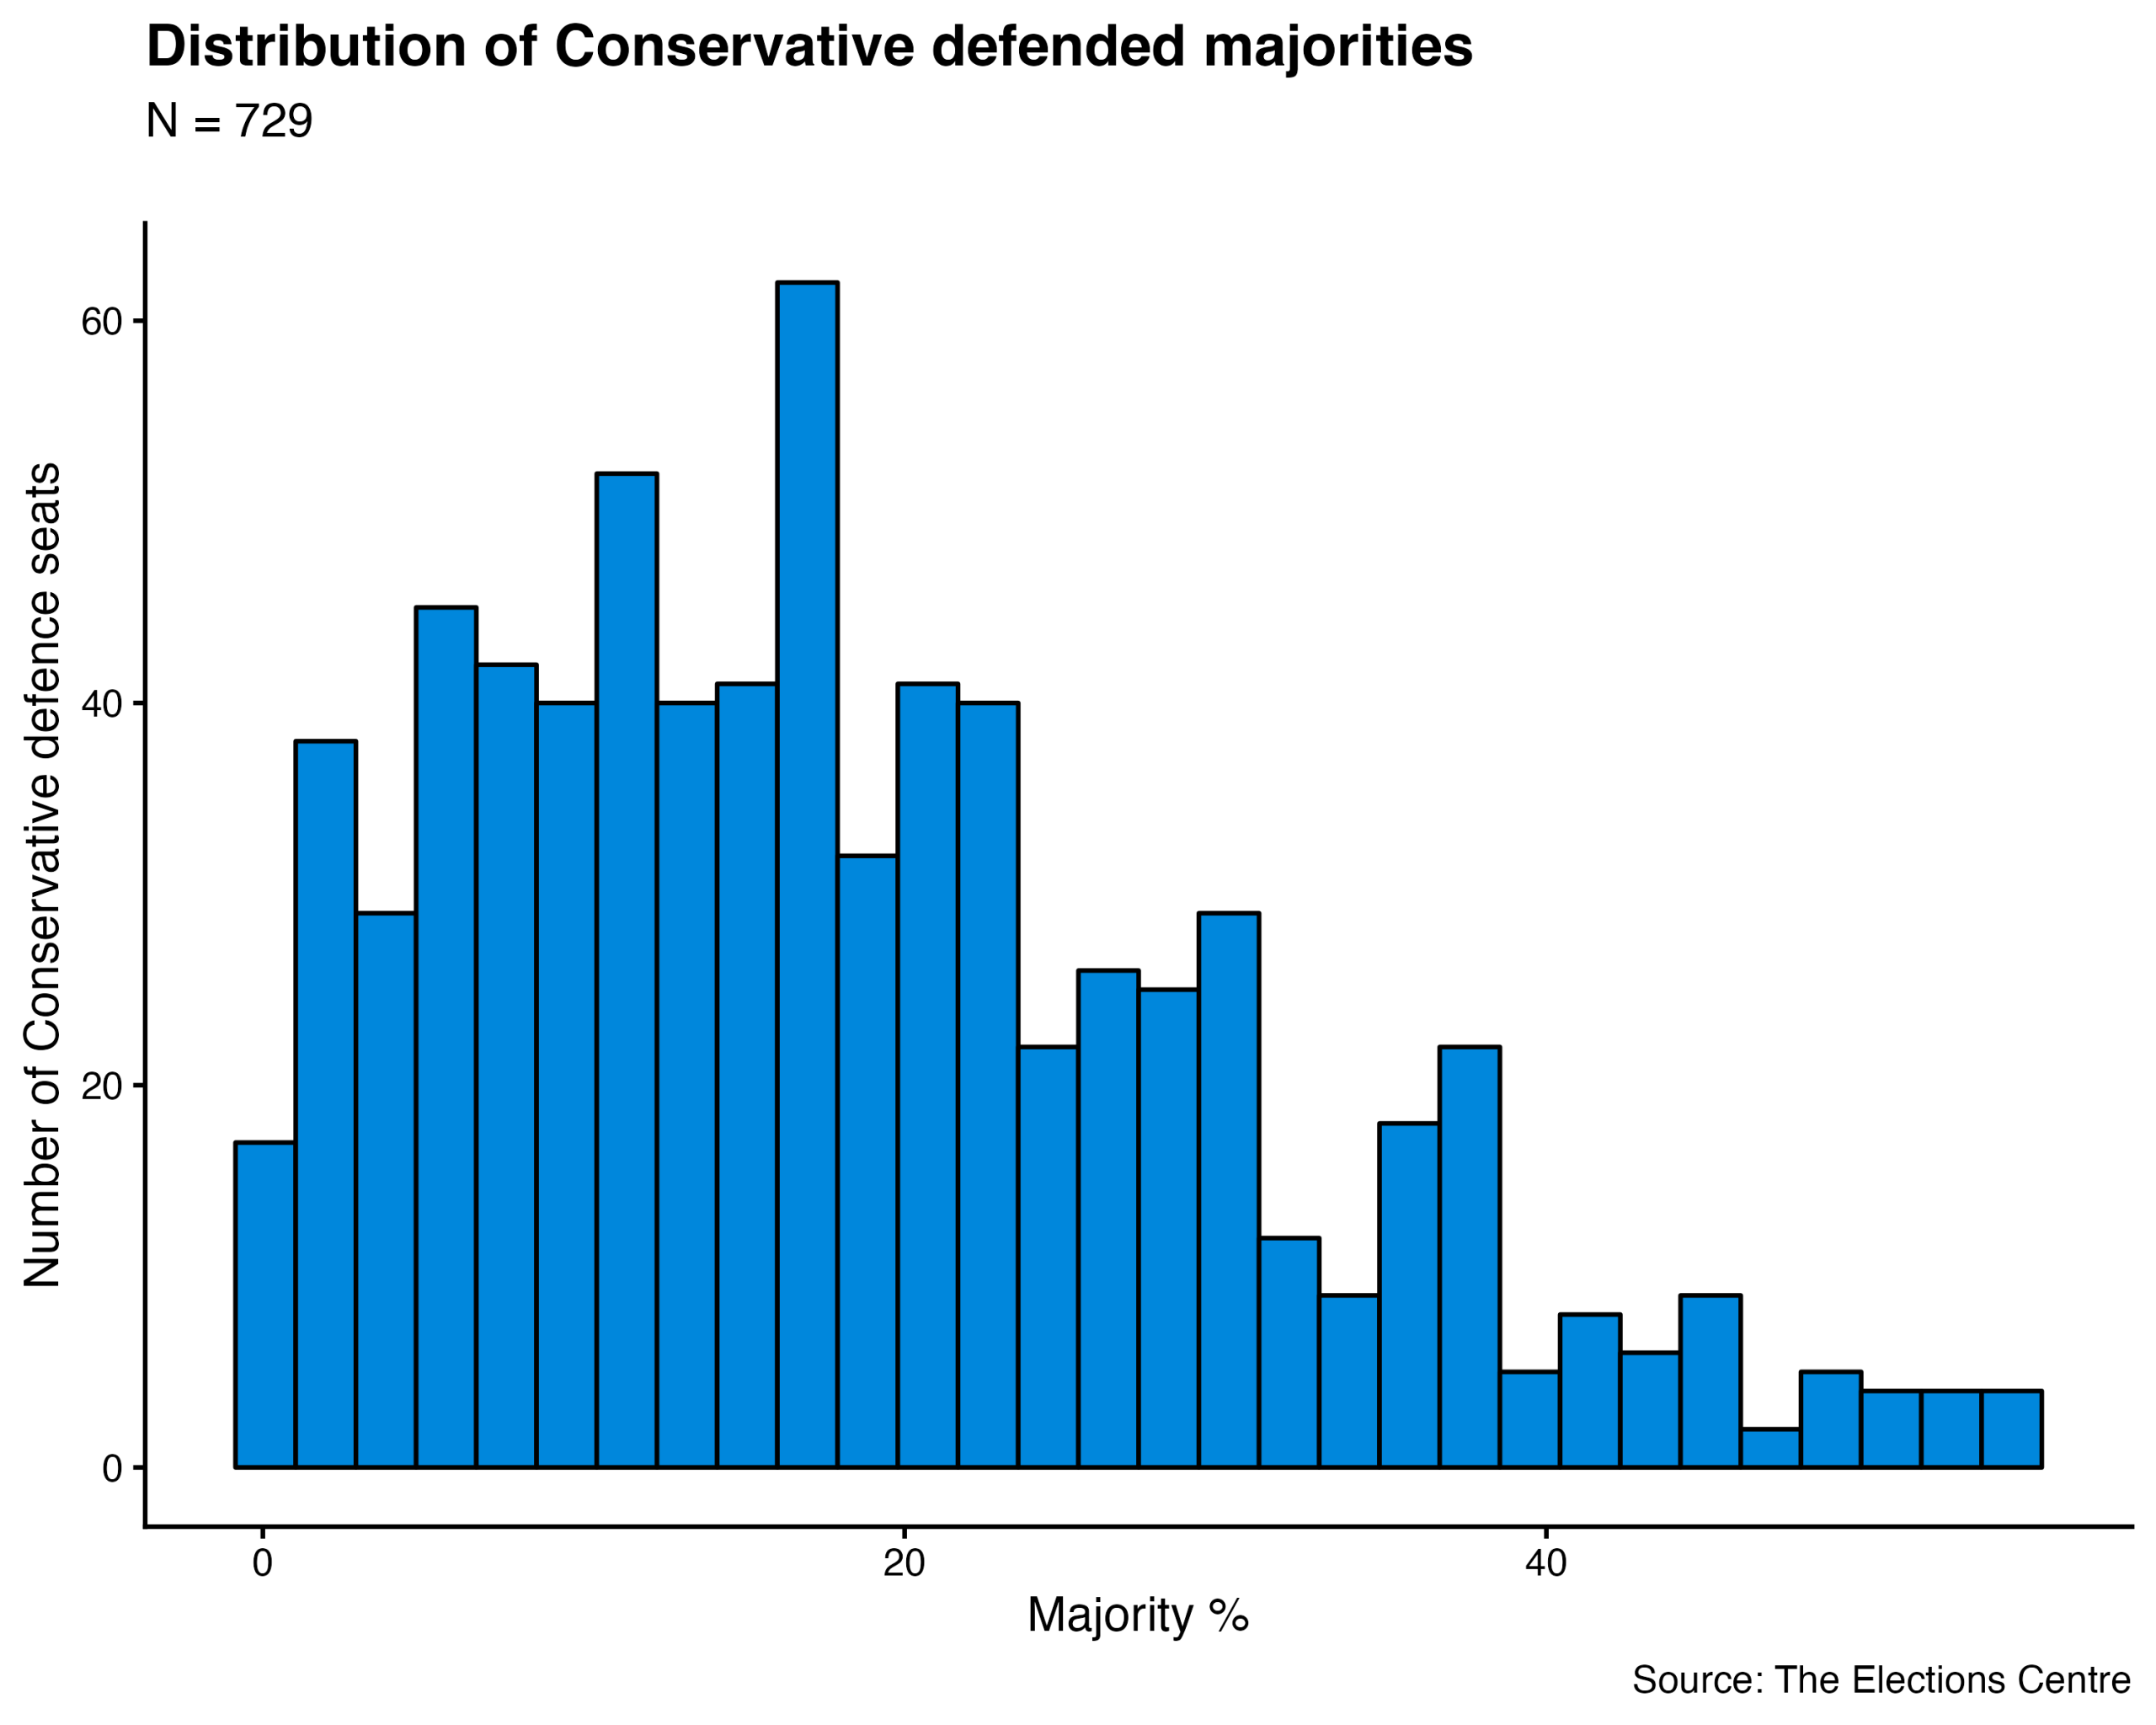
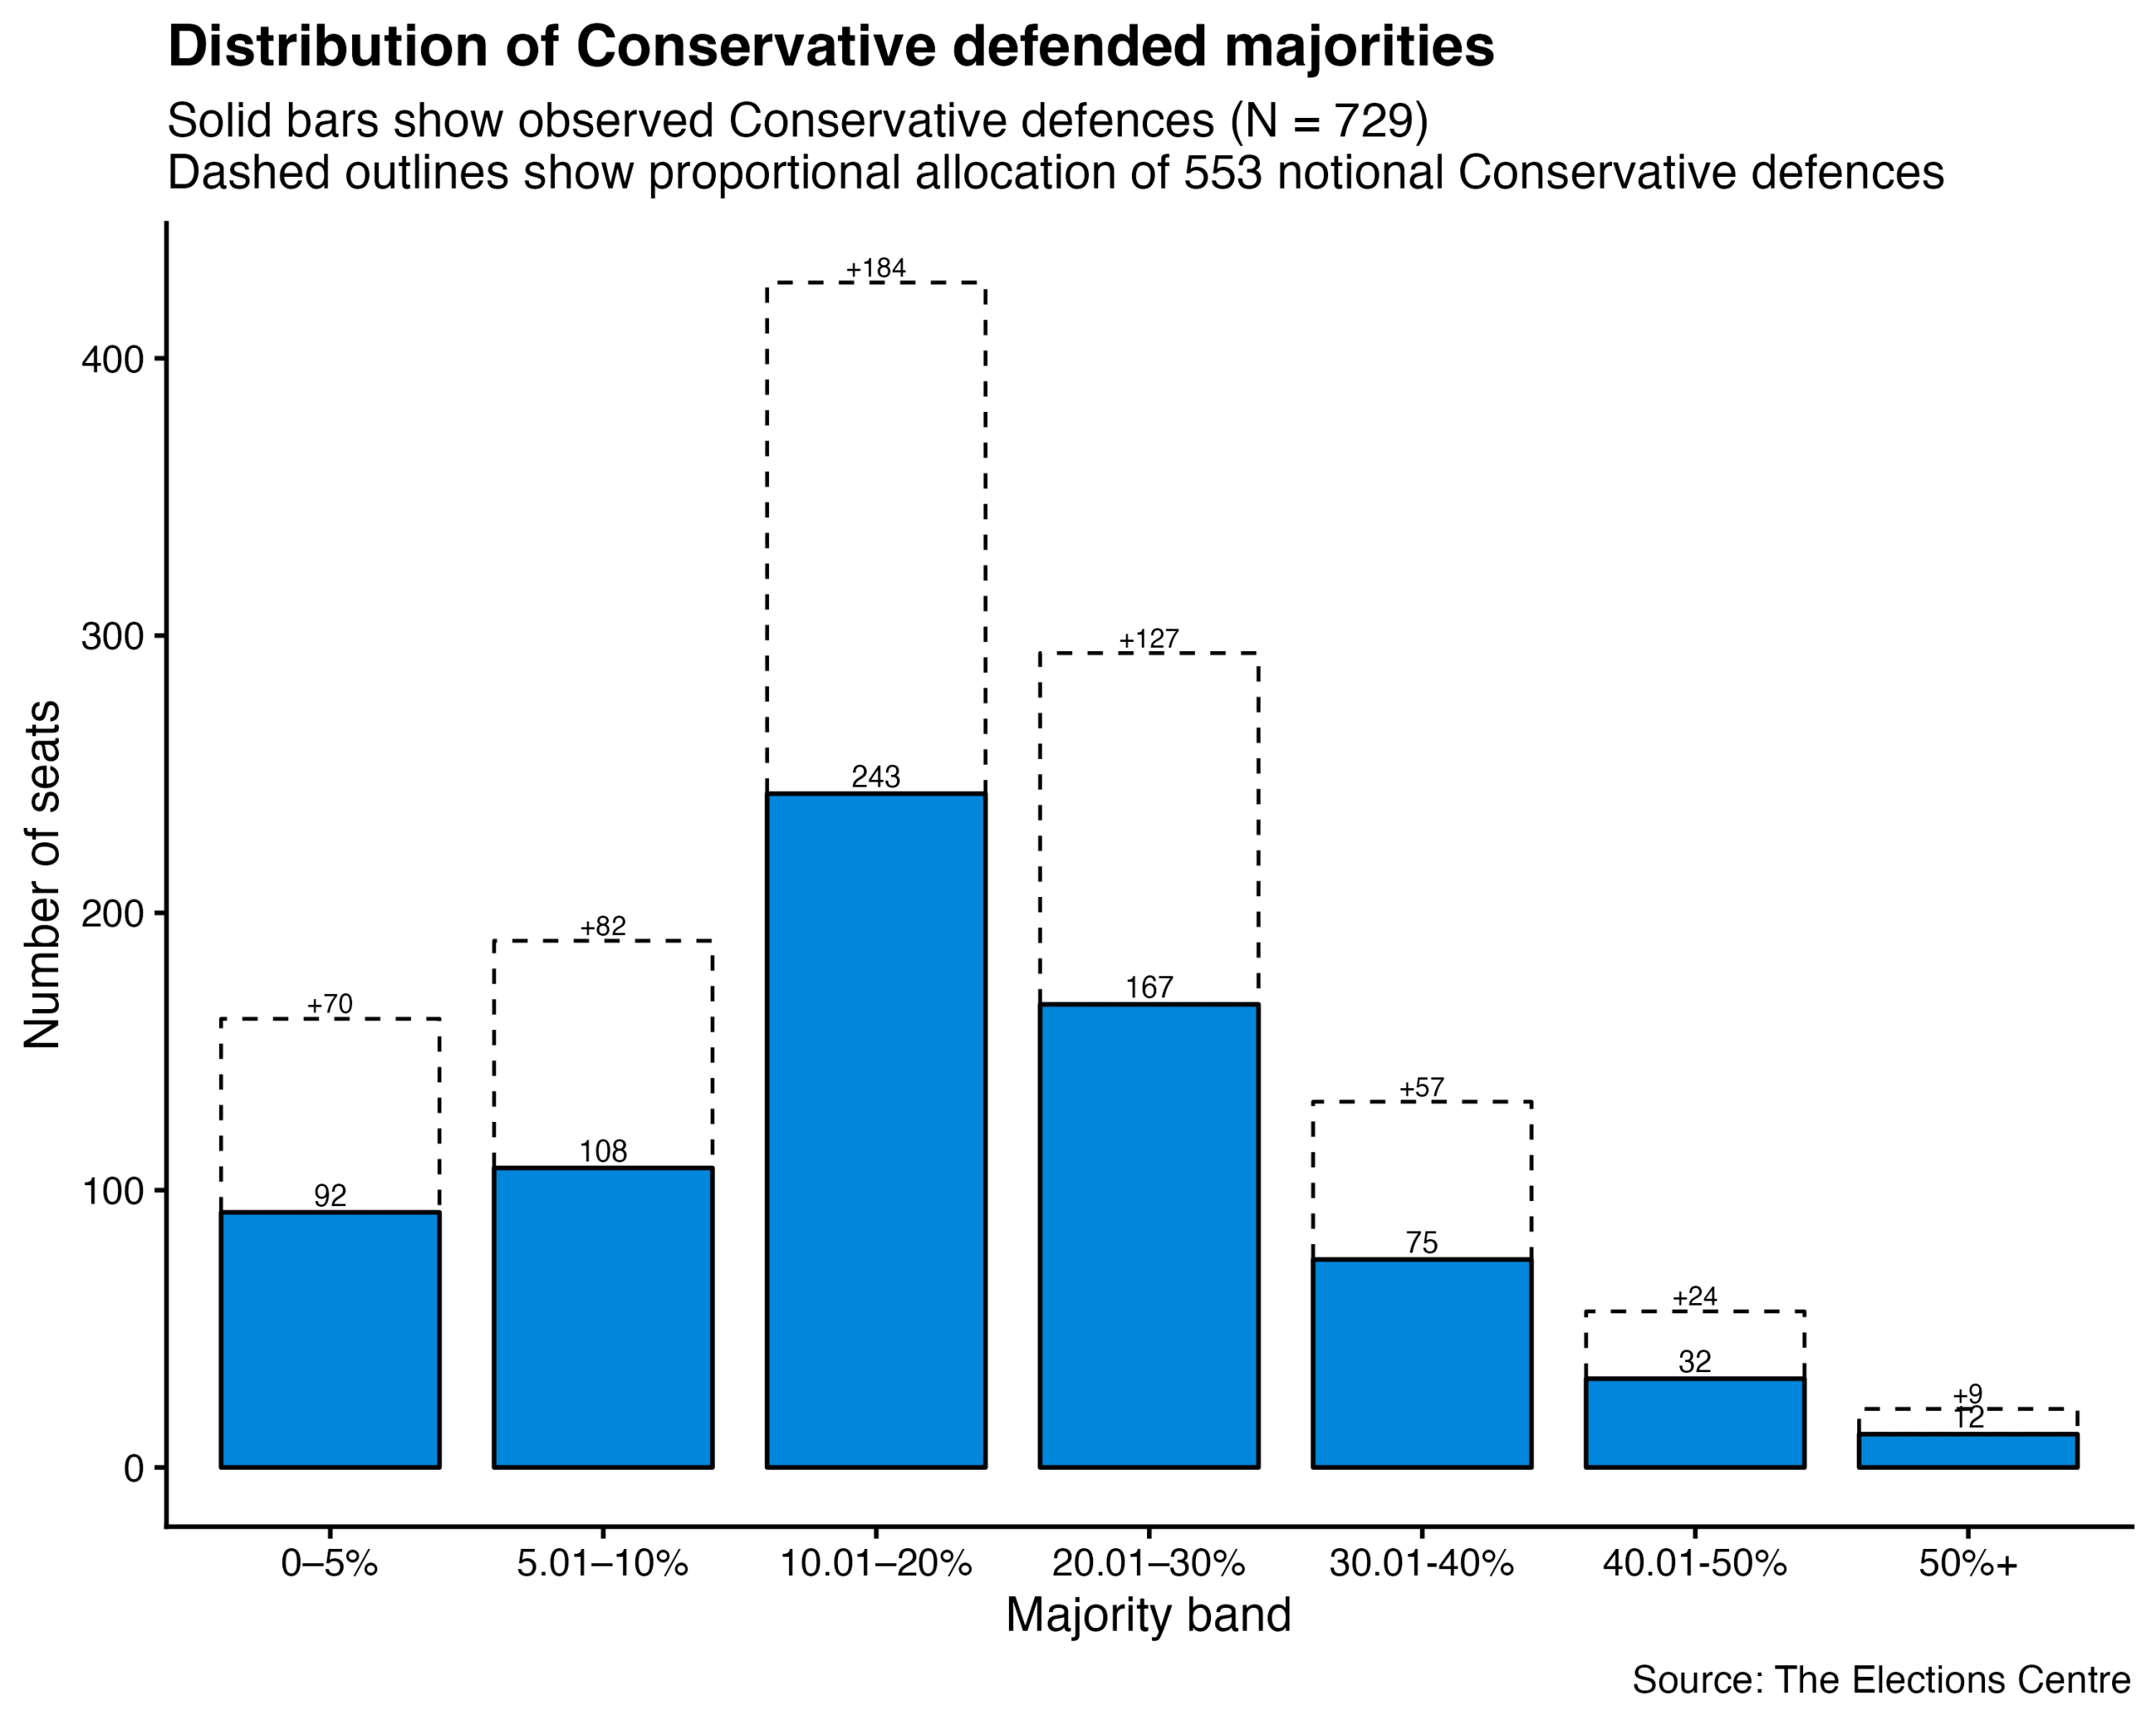
The Conservatives defend more than a quarter of seats, mostly from leafier wards but also in some metropolitan areas. Their majorities are less substantial than Labour’s, perhaps driven by their unpopularity in government the last time these seats were up for election, but still more than one in three of their incumbents have at least a 20% majority to defend.
Their best-case scenario is being down ten percentage points. That would have the Conservatives losing 350 seats where their majority is less than 10%. Yet it is more likely that we see a ten-point swing, meaning their total losses would be 700-800 seats. To hit 1,000 losses, they would need to be losing councillors who defend 30% majorities; they face a heavy threat from Reform in a swathe of these seats, so it just might happen.
Seat-level modelling for a full projection
The final approach is the most complex. By taking the baseline election results for each seat in its corresponding previous election year, adjusting for competitiveness using the candidates standing, and combining them with demographic data, we can compute a full seat-level projection. It is based on a set of assumptions on patterns of party competition and demographic support. Notional results rely not on baseline shares but proportional calibrations.
The baseline years for these elections span 2021-2024 depending on the seat. Reform only began to contest most elections after the general election, and therefore only have three defences this year. The Liberal Democrats defend almost 15% of seats, the Greens just shy of 3%. Others and Independents combined currently hold 5.4% of these seats.
Seat-level local elections projection
| Party |
Baseline defences |
Projected seat total |
Change |
| Conservative |
1,362 |
455 |
-907 |
| Labour |
2,557 |
1,132 |
-1,425 |
| Liberal Democrats |
684 |
1,077 |
+393 |
| Green |
141 |
696 |
+555 |
| Reform UK |
3 |
1,355 |
+1,352 |
| Independents & Others |
266 |
298 | +32 |
Source: The Elections Centre
These estimates predict Reform to win the most seats, finishing with 27% of all seats contested, slightly above their projected NEV. Labour lose the most seats and are forecast to retain 44% of those they defend. The Liberal Democrats come a close third for final seat totals, the Conservatives trailing to fifth and losing two thirds of their incumbents. The Green Party are estimated to pick up the second most gains, finishing with almost five times the number of seats they began with.
Underneath these totals, the model predicts that the majority of Conservative defences are gained by Reform, followed by the Liberal Democrats. Labour lose almost an equal number of seats to the Greens as they do to Reform UK.
Knowns and known unknowns
It is almost certain that Reform will come out on top from these elections. Yet to be determined is in just how many seats they will have enough support to achieve a plurality, and whether the recent evidence of a mobilised anti-Reform vote prevent them winning a series of councillors.
Labour are set to lose at least half of their incumbent councillors. Their sizeable defending majorities will either break records for historic losses, or protect them from a fragmented set of challengers.
The Conservatives are currently the second largest party in local government. If the seat projection above is correct, they would lose that title to the Liberal Democrats. The Conservatives are perhaps the most vulnerable due to their defending majorities, but elections are now being won on much smaller proportions of the vote, meaning that the maths may end up saving them – something Rishi Sunak in particular would be happy about.
Finally, the Green Party will be looking for their overall seat tally to match their national polling and NEV shares, somewhere between 13% and 16% of seats. For all parties, the difference between momentous losses, middling performance and colossal gains could be just a few percentage points per seat.
 View our parent website (electionscentre.co.uk)